
Friday, February 24, 2017
USDJPY analysis for 24.02.2017
While there are no economic reports in Japan, USD is getting weak due to probable Fed monetary policy tightening.
The support rests at 112.580 with resistance at 113.020 which both lines are below the weekly pivot point at 113.450. The EMA of 10 is moving with bearish bias along the descendant channel and it is below the EMA of 100 and the EMA of 200. The RSI is falling towards the oversold area, the Stochastic is showing upward momentum and the MACD indicator is in negative territory. The ADX is showing buy signals.
There are contradictory signals all over the chart therefore traders can wait for a better chart setup before they make up their minds.
https://fxglory.com/usdjpy-analysis-for-24-02-2017/

USDCAD analysis for 24.02.2017
USD is acting weak against its Canadian counterpart and now USDCAD is under the influence of Canadian Consumer Price Index.
The pair is finding support at 1.30800 with resistance at 1.31260 which both lines are above the weekly pivot point at 1.30740. The EMA of 10 is falling down and it has reached the EMA of 100; they are both below the EMA of 200. The RSI is falling down towards the oversold area, the MACD indicator is in neutral territory and the Stochastic is moving in its low ranges. The ADX is showing strong buy signals. The price is below the Ichimoku Cloud and the Chinkou Span. The Tenkan-sen is showing a downward trend while the Kijun-sen is showing a horizontal trend.
While noting that the 1.308 level is a strong support area, the support level breakthrough will pave the way for further decline otherwise, USDCAD will start its bullish trend targeting 1.3190.
https://fxglory.com/usdcad-analysis-for-24-02-2017/


EURUSD analysis for 24.02.2017
Today EURUSD is under the influence of Germany GDP, The GDP and the election in France.
The support rests at 1.05620 with resistance at 1.05940 which both lines are below the weekly pivot point at 1.06030. The EMA of 10 is moving with bullish bias along the ascendant channel and it is below the EMA of 100 and 200. The RSI is moving horizontally on 50 level, the Stochastic is moving in its high ranges and the MACD indicator is in negative territory. The ADX is showing buy signals.
Long positions are recommended targeting 61.8 level of Fibonacci retracement
https://fxglory.com/eurusd-analysis-for-24-02-2017/


Thursday, February 23, 2017
NZDUSD analysis for 23.02.2017
NZDUSD is falling down the descendant channel.
The support rests in 0.71680 with resistance at 0.72240 which the weekly pivot point at 0.71850 is located in between the lines. The EMA of 10 is moving with bullish bias and it has already reached the EMA of 200; they are both below the EMA of 100. The RSI is moving horizontally close to the overbought area, the MACD indicator is in neutral territory and the Stochastic is moving in high ranges. The ADX is showing a buy signal. The price is in the Ichimoku Cloud and above the Chinkou Span. The Tenkan-sen is showing an upward trend while the Kijun-sen is showing a downward trend.
There are not enough signals to forecast the target for sure however, the support level breakthrough will smooth the way for 0.7100.
https://fxglory.com/nzdusd-analysis-for-23-02-2017/


GBPUSD analysis for 23.02.2017
Despite the positive reports of UK’s GDP, GBP was not supported. Taking a long term look, the pair is moving with less volatility creating lower highs and higher lows.
The support rests at 1.24170 with resistance at 1.24690 which the weekly pivot point at 1.24450 is located in between the lines. The EMA of 10 is moving with bearish bias and it is below the EMA of 200 and the EMA of 100. The RSI is moving horizontally on the 50 level, the Stochastic is showing upward momentum and the MACD indicator is in negative territory. The ADX is not showing any clear signals.
The support level breakthrough will be a good sign for sellers to target 1.2350.
https://fxglory.com/gbpusd-analysis-for-23-02-2017/


EURUSD analysis for 23.02.2017
EUR is under pressure due to the election matters in France and the possibility of Fed rate hike in March.
The support rests at 1.05260 with resistance at 1.05860 which both lines are below the weekly pivot point at 1.06030. The EMA of 10 is moving with bearish bias along the descendant channel and it is below the EMA of 100 and 200. The RSI is falling towards the oversold area, the Stochastic is moving in its high ranges and the MACD indicator is in negative territory. The ADX is showing buy signals.
It seems that the pair has already started its bearish trend after passing 38.2 level of Fibonacci retracement therefore short positions are recommended targeting 1.0450.
https://fxglory.com/eurusd-analysis-for-23-02-2017/


Wednesday, February 22, 2017
USDJPY analysis for 22.02.2017
While JPY was acting weak against USD, Japanese Manufacturing PMI supported this pair.
The support rests at 113.250 with resistance at 113.610 which the weekly pivot point at 113.450 is located in between the lines. The EMA of 10 is moving with bullish bias and it is close to the EMA of 100 and the EMA of 200. The RSI is moving horizontally on the 50 level, the Stochastic is showing downward momentum and the MACD indicator is in neutral territory. The ADX is showing buy signals.
The chart seems bullish targeting 115.00.
https://fxglory.com/usdjpy-analysis-for-22-02-2017/


EURUSD analysis for 22.02.2017
While the manufacturing PMI in Germany supported EUR, this currency is under pressure because of the French election therefore it cannot win over the strong USD. The support rests at 1.05020 with resistance at 1.05510 which both lines are below the weekly pivot point at 1.06030. The EMA of 10 is moving with bearish bias along the descendant channel and it is below the EMA of 100 and 200. The RSI is moving in the oversold area, the Stochastic is moving in its low ranges and the MACD indicator is in negative territory. The ADX is showing buy signals. Short positions are recommended targeting 1.0400.
https://fxglory.com/eurusd-analysis-for-22-02-2017/


AUDUSD analysis for 22.02.2017
AUD is weak against its strong American counterpart.
The support rests in 0.76830 with resistance at 0.77010 which both lines are above the weekly pivot point at 0.76710. The EMA of 10 is moving with bullish bias along the ascendant channel and it is located above the EMA of 100 and the EMA of 200. The RSI is rising towards the overbought area, the MACD indicator is in neutral territory and the Stochastic is showing upward momentum. The ADX is showing a buy signal. The price is above the Ichimoku Cloud and the Chinkou Span. The Tenkan-sen is showing a horizontal trend while the Kijun-sen is showing a downward trend.
It seems that 0.77 is a strong resistance zone to be broken therefore short positions are recommended.
https://fxglory.com/audusd-analysis-for-22-02-2017/


Tuesday, February 21, 2017
EURUSD analysis for 21.02.2017
EURUSD is chiefly under the influence of upcoming presidential elections in France and the German Manufacturing PMI.
The support rests at 1.05590 with resistance at 1.06270 which the weekly pivot point at 1.06030 is located in between the lines. The EMA of 10 is moving with bearish bias along the descendant channel and it is below the EMA of 100 and 200. The RSI is falling towards the oversold area, the Stochastic is moving in its low ranges and the MACD indicator is in neutral territory. The ADX is not showing any clear signals.
Since the pair has reached the 61.8 level of Fibonacci retracement, the resistance level breakout will be a good sign for buyers to target 1.0700 otherwise the pair will continue its bearish trend targeting 1.0600.
https://fxglory.com/eurusd-analysis-for-21-02-2017/


GBPUSD analysis for 21.02.2017
GBP is acting stronger against USD due to the American Holiday and the British trial Trends Survey.
The support rests at 1.24310 with resistance at 1.24930 which the weekly pivot point at 1.24450 is located in between the lines. The EMA of 10 is moving horizontally and it has reached EMA of 200; they are both below the EMA of 100. The RSI is moving horizontally below the 50 level, the Stochastic is showing downward momentum and the MACD indicator is in negative territory. The ADX is not showing any clear signals.
Short positions are recommended targeting 1.2400.
https://fxglory.com/gbpusd-analysis-for-21-02-2017/


USDCAD analysis for 21.02.2017
CAD is under pressure due to the different price ranges of Oil which is not align with Fed and the Bank of Canada policies.
The pair is finding support at 1.31090 with resistance at 1.31480 which both lines are above the weekly pivot point at 1.30740. The EMA of 10 is moving with bullish bias along the ascendant channel and it has already passed the EMA of 100; they are both below the EMA of 200. The RSI is moving in overbought area, the MACD indicator is in positive territory and the Stochastic is showing upward momentum. The ADX is showing strong buy signals. The price is above the Ichimoku Cloud and the Chinkou Span. The Tenkan-sen is showing an upward trend while the Kijun-sen is showing a horizontal trend.
The support level breakthrough will smooth the way for further decline targeting 1.3000.
https://fxglory.com/usdcad-analysis-for-21-02-2017/


Monday, February 20, 2017
GBPUSD analysis for 17.02.2017
Despite the negative economic reports such as disappointing inflation and labor market reports, GBP is acting strong against USD.
The support rests at 1.24630 with resistance at 1.25310 which the weekly pivot point at 1.24710 is located in between the lines. The EMA of 10 is moving with bullish bias and it has already passed the EMA of 100 and the EMA of 200. The RSI is moving horizontally above the 50 level, the Stochastic is moving in middle ranges and the MACD indicator is in neutral territory. The ADX is not showing any clear signals.
The resistance level breakout will smooth the way for further growth otherwise, since the price has already hit the 61.8 level of Fibonacci retracement, the pair might fall towards the support area.
https://fxglory.com/gbpusd-analysis-for-17-02-2017/


EURUSD analysis for 17.02.2017
While the employment rate in Germany rose, the unemployment level in France fell but EUR was acting stronger than USD on Thursday.
The support rests at 1.06543 with resistance at 1.06890 which the weekly pivot point at 1.06780 is located in between the lines. The EMA of 10 is moving with bullish bias along the ascendant channel and it is below the EMA of 100 and 200. The RSI is rising towards the overbought area, the Stochastic is moving in its high ranges and the MACD indicator is in neutral territory. The ADX is showing a strong buy signal.
Long positions are recommended along the Andrews’ pitchfork targeting 1.0700.
https://fxglory.com/eurusd-analysis-for-17-02-2017/


AUDUSD analysis for 17.02.2017
AUD ignored the Unemployment data and AUDUSD is climbing up the ascendant channel.
The support rests in 0.76750 with resistance at 0.77230 which both lines are above the weekly pivot point at 0.76560. The EMA of 10 is moving with bullish bias along the ascendant channel and it is located above the EMA of 100 and the EMA of 200. The RSI is moving above the 50 level, the MACD indicator is in positive territory and the Stochastic is showing upward momentum. The ADX is showing a buy signal. The price is above the Ichimoku Cloud and the Chinkou Span. The Tenkan-sen is showing an upward trend while the Kijun-sen is showing a horizontal trend.
Long positions are recommended targeting 0.7800.
https://fxglory.com/audusd-analysis-for-17-02-2017/


USDJPY analysis for 20.02.2017
Today there won’t be any specific economic reports in the US to influence USDJPY, however Japan is releasing Trade Balance.
The support rests at 112.850 with resistance at 113.310 which both lines are below the weekly pivot point at 113.450. The EMA of 10 is moving with bearish bias and it is located below the EMA of 100 and the EMA of 200. The RSI is rising towards the 50 level, the Stochastic is showing upward momentum and the MACD indicator is in negative territory. The ADX is showing buy signals.
Considering the technical chart, the pair is moving upward targeting the 61.8 level of Fibonacci retracement otherwise it will decline and sellers can target 112.00.
https://fxglory.com/usdjpy-analysis-for-20-02-2017/


NZDUSD analysis for 20.02.2017
NZD is releasing Producer Price Index and there is no economic reports in the US for today.
The support rests in 0.71650 with resistance at 0.71890 which the monthly pivot point at 0.71810 is located in between the lines. The EMA of 10 is moving with bearish bias along the descendant channel and it has already reached the EMA of 200; they are both below the EMA of 100. The RSI is rising towards the 50 level, the MACD indicator is in positive territory and the Stochastic is moving in low ranges. The ADX is showing a buy signal. The price is below the Ichimoku Cloud and the Chinkou Span. The Tenkan-sen is showing downward trend while the Kijun-sen is showing a horizontal trend.
The resistance level breakout will smooth the way for further growth targeting 0.7250, otherwise it will drop to 0.7100.
https://fxglory.com/nzdusd-analysis-for-20-02-2017/


EURUSD analysis for 20.02.2017
USD is getting weak due to the Presidents’ Day.
The support rests at 1.05990 with resistance at 1.06270 which both lines are below the monthly pivot point at 1.06490. The EMA of 10 is moving with bearish bias along the descendant channel and it is below the EMA of 100 and 200. The RSI is moving below the 50 level, the Stochastic is moving in its low ranges and the MACD indicator is in neutral territory. The ADX is showing a weak buy signal.
It seems that the pair is falling down within Andrews’ pitchfork targeting 1.0550.
https://fxglory.com/eurusd-analysis-for-20-02-2017/


Thursday, February 16, 2017
EURUSD analysis for 16.02.2017
Yellen’s speech supported USD and on the other hand consumer price index in Spain put pressure on EUR.
The support rests at 1.05760 with resistance at 1.06560 which both lines are below the weekly pivot point at 1.06780. The EMA of 10 is moving with bullish bias along the ascendant channel and it is below the EMA of 100 and 200. The RSI is rising towards the 50 level, the Stochastic is moving in its high ranges and the MACD indicator is in negative territory. The ADX is not showing any clear signals.
Despite EURUSD attempt to rise, the pair will continue its bearish trend targeting 1.0550.
https://fxglory.com/eurusd-analysis-for-16-02-2017/


USDCAD analysis for 16.02.2017
USDCAD is chiefly under the influence of US economic reports such as retail sales and the CPI data.
The pair is finding support at 1.30320 with resistance at 1.30720 which both lines are below the weekly pivot point at 1.30990. The EMA of 10 is moving with bearish bias and it is located below the EMA of 100 and the EMA of 200. The RSI is moving below the 50 level, the MACD indicator is in negative territory and the Stochastic is showing downward momentum. The ADX is not showing any clear signals.
Today USDCAD will be fluctuating within 1.30 and 1.31 area.
https://fxglory.com/usdcad-analysis-for-16-02-2017/


USDJPY analysis for 16.02.2017
USD was empowered by Yellen’s speech.
The support rests at 113.670 with resistance at 114.090 which both lines are above the weekly pivot point at 112.860. The EMA of 10 is moving with bearish bias but it is located above the EMA of 100 and the EMA of 200. The RSI is moving horizontally on 50 level, the Stochastic is moving in low ranges and the MACD indicator is in positive territory. The ADX is showing buy signals. The price is above the Ichimoku Cloud and the Chinkou Span. The Tenkan-sen and the Kijun-sen are both showing a horizontal trend.
It seems that USDJPY is rising within the ascendant channel targeting 116.00.
https://fxglory.com/usdjpy-analysis-for-16-02-2017/


Wednesday, February 15, 2017
EURUSD analysis for 15.02.2017
EUR is getting weak due to Germany and Eurozone data, the preliminary Eurozone GDP and the Eurozone Economic Sentiment.
The support rests at 1.05170 with resistance at 1.05870 which both lines are below the weekly pivot point at 1.06780. The EMA of 10 is moving with bearish bias along the descendant channel and it is below the EMA of 100 and 200. The RSI is moving in oversold area, the Stochastic is moving in its low ranges and the MACD indicator is in negative territory. The ADX is showing a weak buy signal.
The pair is falling within Andrews’ pitchfork however it might not go lower than 0.05350 therefore the short term sell orders are recommended.
https://fxglory.com/eurusd-analysis-for-15-02-2017/


GBPUSD analysis for 15.02.2017
GBP is losing momentum due to inflation data.
The support rests at 1.23790 with resistance at 1.24870 which the weekly pivot point at 1.24710 is located in between the lines. The EMA of 10 is moving with bearish bias and it has already passed the EMA of 100 but it is above the EMA of 200. The RSI is falling towards the oversold area, the Stochastic is moving in low ranges and the MACD indicator is in neutral territory. The ADX is not showing any clear signals. The price is below the Ichimoku Cloud and the Chinkou Span. The Tenkan-sen and the Kijun-sen are both showing a downward trend.
Short positions are recommended targeting 1.2350.
https://fxglory.com/gbpusd-analysis-for-15-02-2017/


USDJPY analysis for 15.02.2017
Japanese Industrial production supported JPY against USD.
The support rests at 114.160 with resistance at 114.680 which both lines are above the weekly pivot point at 112.860. The EMA of 10 is moving with bullish bias along the ascendant channel and it is located above the EMA of 100 and below the EMA of 200. The RSI is moving horizontally in overbought area, the Stochastic is moving in high ranges and the MACD indicator is in positive territory. The ADX is showing buy signals.
Long positions are recommended targeting 114.700.
https://fxglory.com/usdjpy-analysis-for-15-02-2017/


Monday, February 13, 2017
EURUSD analysis for 13.02.2017
The strong French Non-Farm Payrolls could not help EUR to grow due to several elections in France, Italy and Germany.
The support rests at 1.05850 with resistance at 1.06650 which both lines are below the weekly pivot point at 1.06770. The EMA of 10 is moving with bearish bias along the descendant channel and it is below the EMA of 100 and 200. The RSI is rising towards the 50 level area, the Stochastic is showing upward momentum and the MACD indicator is in negative territory. The ADX is showing a buy signal.
EURUSD is creating a correction pattern after leaving the previous low at 1.0606 therefore it will rise towards the 50 level of Fibonacci retracement.
https://fxglory.com/eurusd-analysis-for-13-02-2017/


USDJPY analysis for 13.02.2017
USD was empowered due to Trump’s decision regarding the “One China” policy.
The support rests at 113.470 with resistance at 114.110 which both lines are above the weekly pivot point at 113.150. The EMA of 10 is moving with bullish bias and it is located above the EMA of 100 and below the EMA of 200. The RSI is moving horizontally close to the overbought area, the Stochastic is moving in high ranges and the MACD indicator is in positive territory. The ADX is showing buy signals. The price is above the Ichimoku Cloud and below Chinkou Span. The Tenkan-sen and the Kijun-sen are both showing a horizontal trend.
Long positions are recommended targeting 114.551.
https://fxglory.com/usdjpy-analysis-for-13-02-2017/


USDCAD analysis for 13.02.2017
USDCAD is falling within the descendant channel creating lower lows and lower highs.
The pair is finding support at 1.30620 with resistance at 1.31380 which both lines are above the weekly pivot point at 1.30520. The EMA of 10 is moving with bearish bias and it is located below the EMA of 100 and the EMA of 200. The RSI is rising towards the 50 level, the MACD indicator is in positive territory and the Stochastic is showing upward momentum. The ADX is not showing any clear signals.
The support level breakthrough will smooth the way for further decline targeting 1.3050.
https://fxglory.com/usdcad-analysis-for-13-02-2017/


Friday, February 10, 2017
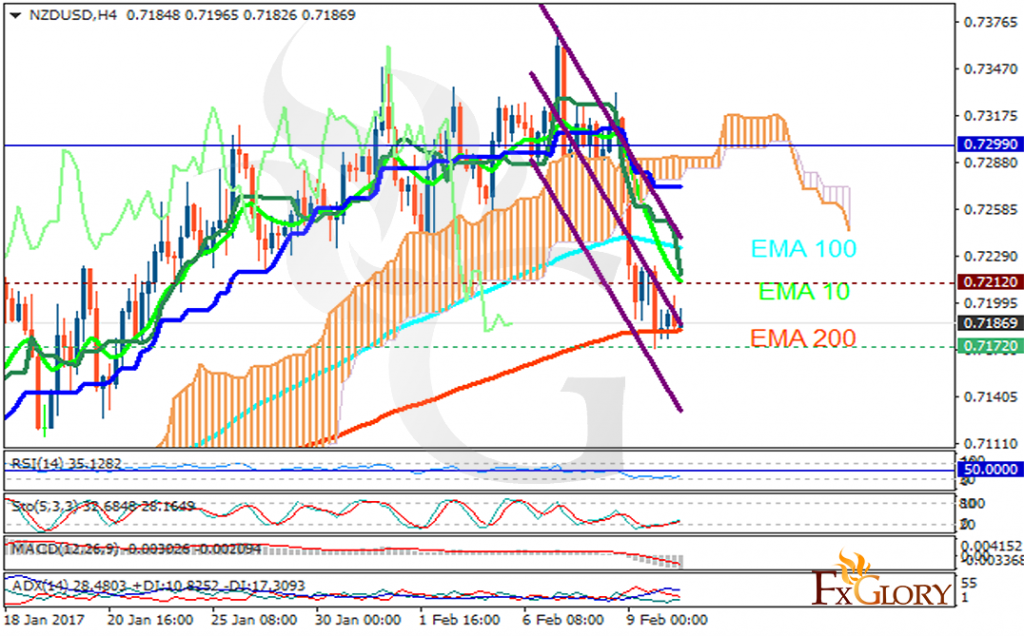
NZDUSD analysis for 10.02.2017
NZD is acting weak against its American counterpart due to the Reserve Bank of New Zealand decision to leave the rate unchanged.
The support rests in 0.71720 with resistance at 0.72120 which both lines are below the weekly pivot point at 0.72990. The EMA of 10 is moving with bearish bias and it is located below the EMA of 100 and above the EMA of 200. The RSI is moving in oversold area, the MACD indicator is in negative territory and the Stochastic is showing upward momentum. The ADX is showing a weak sell signal. The price is below the Ichimoku Cloud and the Chinkou Span. The Tenkan-sen is showing a downward trend and the Kijun-sen is showing a horizontal trend.
The support level breakthrough will smooth the way for further decline otherwise the pair will rise towards 0.7300.
https://fxglory.com/nzdusd-analysis-for-10-02-2017/

GBPUSD analysis for 10.02.2017
GBP was supported by the British PM.
The support rests at 1.24900 with resistance at 1.25130 which both lines are below the weekly pivot point at 1.25320. The EMA of 10 is moving horizontally within the ascendant channel and it is above the EMA of 200 and the EMA of 100. The RSI is moving on 50 level, the Stochastic is moving in low ranges and MACD indicator is in neutral territory. The ADX is showing a weak sell signal.
It seems that the bulls are taking the control of the chart therefore buyers can target 1.2700.
https://fxglory.com/gbpusd-analysis-for-10-02-2017/


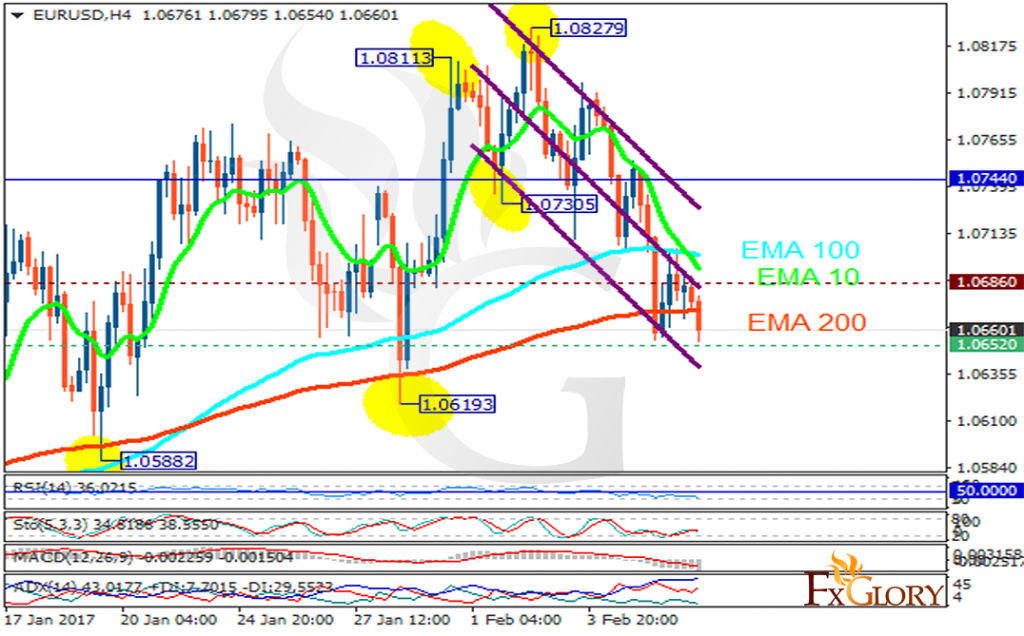
EURUSD analysis for 10.02.2017
EURUSD is moving with bearish tendency creating lower highs and lower lows. The weak export and trade balance data in Germany also did not influence this pair much.
The support rests at 1.06410 with resistance at 1.06730 which both lines are below the weekly pivot point at 1.07440. The EMA of 10 is moving with bearish bias and it has already crossed the EMA of 100 and the EMA of 200. The RSI is rising towards the 50 level area, the Stochastic is showing downward momentum and the MACD indicator is in negative territory. The ADX is showing a weak sell signal. The pair will continue its decline within Andrews’ pitchfork.
Short positions are recommended targeting 1.0600.
https://fxglory.com/eurusd-analysis-for-10-02-2017/


Thursday, February 9, 2017
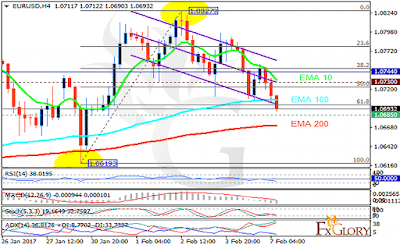
EURUSD analysis for 09.02.2017
EUR is acting weak due to M. Draghi’s comments. The support rests at 1.06550 with resistance at 1.07090 which both lines are below the weekly pivot point at 1.07440. The EMA of 10 is moving horizontally and it has already crossed the EMA of 100 but both of them are above the EMA of 200. The RSI is rising towards the 50 level area, the Stochastic is showing downward momentum and the MACD indicator is in negative territory. The ADX is not showing any clear signals. The resistance level breakout will smooth the way for further growth otherwise, the pair will drop to 1.0600.
https://fxglory.com/eurusd-analysis-for-09-02-2017/


USDJPY analysis for 09.02.2017
The high demand for the US Treasury bond yields supported the USD.
The support rests at 111.900 with resistance at 112.460 which both lines are below the weekly pivot point at 113.180. The EMA of 10 is moving with bearish bias along the descendant channel and it is below the EMA of 200 and the EMA of 100. The RSI is rising towards the 50 level, the Stochastic is showing upward momentum and the MACD indicator is in negative territory. The ADX is showing buy signals.
USDJPY is rising towards the 38.2 level of Fibonacci targeting 113 area.
https://fxglory.com/usdjpy-analysis-for-09-02-2017/


AUDUSD analysis for 09.02.2017
AUD was supported due to copper demand.
The support rests in 0.76270 with resistance at 0.76720 which the weekly pivot point at 0.76340 is located in between the lines. The EMA of 10 is moving horizontally and it is located above the EMA of 100 and the EMA of 200. The RSI is moving on 50 level, the MACD indicator is in neutral territory and the Stochastic is showing upward momentum. The ADX is not showing any clear signals. The price is above the Ichimoku Cloud and the Chinkou Span. The Tenkan-sen and the Kijun-sen are both showing a horizontal trend.
The chart seems bullish for today targeting 0.7700.
https://fxglory.com/audusd-analysis-for-09-02-2017/


Wednesday, February 8, 2017
USDCAD analysis for 08.02.2017
CAD is acting weak against its American counterpart due to the oil price and the strong USD.
The pair is finding support at 1.31600 with resistance at 1.31890 which both lines are above the weekly pivot point at 1.30520. The EMA of 10 is moving with bullish bias and it is located above the EMA of 100 and below the EMA of 200. The RSI is falling towards the 50 level, the MACD indicator is in positive territory but the Stochastic is showing downward momentum. The ADX is showing a buy signal. The price is in the Ichimoku Cloud and below the Chinkou Span. The Tenkan-sen and the Kijun-sen are both showing a horizontal trend.
The pair will continue its growth towards 1.31
https://fxglory.com/usdcad-analysis-for-08-02-2017/


GBPUSD analysis for 08.02.2017
While Like-For-Like Retail Sales and Halifax House Prices supported GBP, Brexit is leaving negative impact on this currency.
The support rests at 1.24730 with resistance at 1.25090 which both lines are below the weekly pivot point at 1.25320. The EMA of 10 is moving with Bullish bias along the ascendant channel and it is above the EMA of 200 and the EMA of 100. The RSI is moving on 50 level, the Stochastic is moving in high ranges and but the MACD indicator is in negative territory. The ADX is showing sell signals. It seems that the correction pattern is almost complete before reaching the 61.8 level of Fibonacci, therefore we stay bearish targeting 1.2300.
https://fxglory.com/gbpusd-analysis-for-08-02-2017/


EURUSD analysis for 08.02.2017
EUR is under pressure due to Industrial Production in Germany.
The support rests at 1.06520 with resistance at 1.06860 which both lines are below the weekly pivot point at 1.07440. The EMA of 10 is moving with bearish bias along the descendant channel and it has already crossed the EMA of 100 but both of them are above the EMA of 200. The RSI is falling towards the oversold area, the Stochastic is moving in low ranges and the MACD indicator is in negative territory. The ADX is showing sell signals.
The pair will go lower targeting 1.0600.
https://fxglory.com/eurusd-analysis-for-08-02-2017/

Tuesday, February 7, 2017

NZDUSD analysis for 07.02.2017
NZDUSD is climbing the ascendant channel creating higher highs and higher lows. Today it started its pullback.
The support rests in 0.73260 with resistance at 0.73860 which both lines are above the weekly pivot point at 0.72990. The EMA of 10 is moving with bullish bias and it is located above the EMA of 100 and the EMA of 200. The RSI is falling towards the 50 level, the MACD indicator is in positive territory and the Stochastic is moving in high ranges. The ADX is showing a buy signal. The price is above the Ichimoku Cloud and below Chinkou Span. The Tenkan-sen is showing upward trend while the Kijun-sen is showing a horizontal trend.
Despite the positive indicators showing upwards momentum, NZDUSD will probably touch the 0.72 area and then might continue its growth.
https://fxglory.com/nzdusd-analysis-for-07-02-2017/


USDJPY analysis for 07.02.2017
USD is not acting strong in USDJPY due to the US jobs report on Friday.
The support rests at 111.640 with resistance at 112.040 which both lines are below the weekly pivot point at 113.180. The EMA of 10 is moving with bearish bias and it is located above the EMA of 200 and the EMA of 100. The RSI is moving horizontally close to the oversold area, the Stochastic is moving in low ranges and the MACD indicator is in negative territory. The ADX is not showing any clear signals.
USDJPY will continue its bearish tone towards 111.50 then buyers can open their positions and gain profit.
https://fxglory.com/usdjpy-analysis-for-07-02-2017/


EURUSD analysis for 07.02.2017
Even the positive Factory Orders in Germany could not support EUR against the strong USD.
The support rests at 1.06850 with resistance at 1.07300 which both lines are below the weekly pivot point at 1.07440. The EMA of 10 is moving with bearish bias along the descendant channel but it is above the EMA of 100 and 200. The RSI is falling towards the oversold area, the Stochastic is showing downward momentum and the MACD indicator is in neutral territory. The ADX is showing a buy signal.
The support level breakthrough will be a good opportunity for buyers to make profit by the price growth when it has already passed the 61.8 level of Fibonacci retracement.
https://fxglory.com/eurusd-analysis-for-07-02-2017/

AUDUSD analysis for 06.02.2017
AUD was weakened due to Poor Chinese PMI, on the other hand, the US treasury bond yields supported USD.
The support rests in 0.76440 with resistance at 0.76830 which both lines are above the weekly pivot point at 0.76340. The EMA of 10 is moving with bullish bias along the ascendant channel and it is located above the EMA of 100 and the EMA of 200. The RSI is falling towards the 50 level, the MACD indicator is in positive territory and the Stochastic is showing downward momentum. The ADX is showing a buy signal. The price is above the Ichimoku Cloud and below Chinkou Span. The Tenkan-sen and the Kijun-sen are both showing a horizontal trend. The resistance level breakout may lead the price towards 0.7700 however it will start its bearish trend targeting 0.7550.
https://fxglory.com/audusd-analysis-for-06-02-2017/


GBPUSD analysis for 06.02.2017
GBP is under pressure due to the Services PMI and the strong USD.
The support rests at 1.24720 with resistance at 1.25020 which both lines are below the weekly pivot point at 1.25320. The EMA of 10 is moving with bearish bias along the descendant channel but it is above the EMA of 200 and the EMA of 100. The RSI is moving below the 50 level, the Stochastic is moving horizontally in neutral area and the MACD indicator is in negative territory. The ADX is showing buy signals.
The pair is falling down within Andrew’s pitchfork targeting 1.2400.
https://fxglory.com/gbpusd-analysis-for-06-02-2017/


EURUSD analysis for 06.02.2017
USD is acting stronger than EUR due to Eurozone mixed data such as Composite PMI, Composite PMI from Markit and Retail Sales report.
The support rests at 1.07660 with resistance at 1.07880 which both lines are above the weekly pivot point at 1.07440. The EMA of 10 is moving horizontally and it is above the EMA of 100 and 200. The RSI is moving close to the 50 level, the Stochastic is showing downward momentum and the MACD indicator is in positive territory. The ADX is showing a weak buy signal.
Sellers can target 1.0700 for a short term trade however the pair will start its bullish bias in longer time period.
https://fxglory.com/eurusd-analysis-for-06-02-2017/


Friday, February 3, 2017
USDJPY analysis for 03.02.2017
There have been no important economic reports to influence USDJPY.
The support rests at 112.600 with resistance at 113.320 which both lines are below the weekly pivot point at 114.310. The EMA of 10 is moving with bullish bias but it is below the EMA of 200 and the EMA of 100. The RSI is rising towards the 50 level, the Stochastic is showing upward momentum and the MACD indicator is in negative territory. The ADX is not showing any clear signals.
The price has already touched the 61.8 level of Fibonacci retracement therefore it is time to start its bearish trend targeting 112.50.
https://fxglory.com/usdjpy-analysis-for-03-02-2017/


USDCAD analysis for 03.02.2017
USDCAD is falling along the descendant channel creating lower highs and lower lows.
The pair is finding support at 1.30120 with resistance at 1.30460 which both lines are below the weekly pivot point at 1.31790. The EMA of 10 is moving with bearish bias and it is located below the EMA of 100 and EMA of 200. The RSI is moving horizontally below the 50 level, the MACD indicator is in negative territory but the Stochastic is moving in high ranges. The ADX is showing a weak sell signal. The price is below the Ichimoku Cloud and on the Chinkou Span. The Tenkan-sen is showing downward trend while the Kijun-sen is showing a horizontal trend.
Short positions are recommended targeting 1.2910.
https://fxglory.com/usdcad-analysis-for-03-02-2017/


EURUSD analysis for 03.02.2017
EUR was supported by the Spain Unemployment rate.
The support rests at 1.07320 with resistance at 1.07840 which both lines are above the weekly pivot point at 1.07090. The EMA of 10 is moving with bearish bias and it is above the EMA of 100 and the EMA of 200. The RSI is moving on the 50 level, the Stochastic is moving in low ranges but the MACD indicator is in positive territory. The ADX is showing sell signal.
The support level breakthrough is a good signal for sellers to target 1.0600 otherwise the pair will grow to 1.8050.
https://fxglory.com/eurusd-analysis-for-03-02-2017/


Thursday, February 2, 2017
NZDUSD analysis for 02.02.2017
NZDUSD is under the influence of BNZ data and Unemployment Rate.
The support rests in 0.72800 with resistance at 0.73160 which both lines are above the weekly pivot point at 0.72420. The EMA of 10 is moving with bullish bias and it is located above the EMA of 100 and the EMA of 200. The RSI is moving above the 50 level, the MACD indicator is in positive territory and the Stochastic is showing upward momentum. The ADX is not showing any clear signals.
The resistance level breakout will smooth the way for further growth targeting 0.7350 area.
https://fxglory.com/nzdusd-analysis-for-02-02-2017/


GBPUSD analysis for 02.02.2017
GBP gained momentum due to UK’s Manufacturing PMI.
The support rests at 1.26450 with resistance at 1.26960 which both lines are above the weekly pivot point at 1.25290. The EMA of 10 is moving with Bullish bias along the ascendant channel and it is above the EMA of 200 and the EMA of 100. The RSI is moving in overbought area, the Stochastic is showing upward momentum and the MACD indicator is in positive territory. The ADX is showing buy signals. The price is above the Ichimoku Cloud and on the Chinkou Span. The Tenkan-sen is showing upward trend while the Kijun-sen is showing a horizontal trend.
Long positions are recommended targeting 1.2700.
https://fxglory.com/gbpusd-analysis-for-02-02-2017/


EURUSD analysis for 02.02.2017
While EUR is being supported by the upbeat inflation figures, USD is under pressure due to Trump’s team accusation of Germany, China and Japan.
The support rests at 1.07690 with resistance at 1.08070 which both lines are above the weekly pivot point at 1.07090. The EMA of 10 is moving with bullish bias along the ascendant channel and it is above the EMA of 100 and the EMA of 200. The RSI is above the 50 level, the Stochastic is showing upward momentum and the MACD indicator is in positive territory. The ADX is showing buy signal.
It seems that the pair is climbing up the Andrew’s pitchfork targeting 1.0850 otherwise it will drop to 1.0750.
https://fxglory.com/eurusd-analysis-for-02-02-2017/


Wednesday, February 1, 2017
AUDUSD analysis for 01.02.2017
AUD has been supported by the Private Sector Credit.
The support rests in 0.75370 with resistance at 0.75910 which the weekly pivot point at 0.75550 is located in between the lines. The EMA of 10 is moving horizontally and it is located above the EMA of 100 and the EMA of 200. The RSI is rising above the 50 level, the MACD indicator is in neutral territory and the Stochastic is showing downward momentum. The ADX is showing a buy signal. The price is above the Ichimoku Cloud and the Chinkou Span. The Tenkan-sen is showing an upward trend and the Kijun-sen is showing horizontal trend.
Long positions are recommended targeting 0.760 area.
https://fxglory.com/audusd-analysis-for-01-02-2017/


Subscribe to:
Posts (Atom)