Thursday, March 31, 2016

Technical analysis of USDJPY dated 31.03.2016

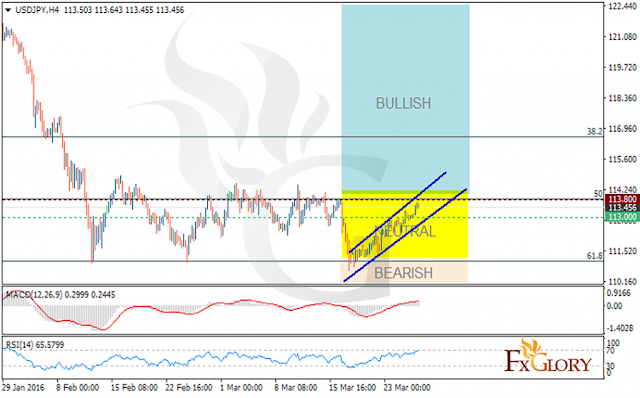
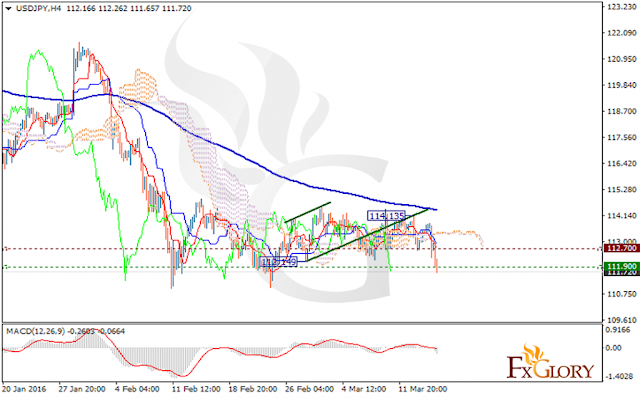
USDJPY is expected to move in lower ranges since USD is losing its power with the Wall Street Journal Dollar Index. This pair is under the influence of Yellen’s speech, the release of US economic data such as the Chicago PMI, Challenger Job Cuts y/y and Natural Gas Storage for USD and the release of Housing Starts y/y for JPY. The pair is going to act more volatile today. The price is getting close to the daily pivot point at 112.41 finding support at 112.030 with resistance at 112.82. The EMA 56 is meeting the EMA 11. The MACD indicator is in neutral zone and the RSI is below 50 level showing the price fall. Short positions are recommended as far as the price drops below the pivot point. Sellers can target 112.05 level followed by 111.60.

https://fxglory.com/technical-analysis-of-usdjpy-dated-31-03-2016/

Technical analysis of GBPUSD dated 31.03.2016


The Federal Reserve Chairman speech made USD weak against GBP. Surprisingly, Brexit could not devalue GBP and instead this asset is growing. Then price correction from the previous low at 1.3839 is almost done and the pair is trying to reach higher levels above the monthly pivot point at 1.4139 which is close to the Fibonacci retracement at 38.2%. Moreover the EMA 10 is currently above the EMA 50. The support is seen at 1.4320 with resistance at 1.4400. The MACD indicator is in positive territory confirming the price growth along with the RSI above 50. The price will probably break the resistance level at 0.4400 and target 1.4480 later.

https://fxglory.com/technical-analysis-of-gbpusd-dated-31-03-2016/


Technical analysis of EURUSD dated 31.03.2016

As we mentioned yesterday, EURUSD will be affected by the Yellen’s speech and now it has already been influenced and pushed the price in high levels. On the other hand USD could not be supported by the consumer confidence data in US. The price growth to 1.1350 confirms the rebound from the 10th of March low at 1.8240. The pair is finding support at 1.1260 close to the Fibonacci retracement at 78.6 with resistance at 1.1350 and is moving above the weekly pivot point at 1.1189. The MACD indicator is showing the price growth since it is in positive territory and also the RSI is above the 50 level. The pair is trying to break the resistance level at 1.1350. Buyers can target 1.1450 at the moment.

https://fxglory.com/technical-analysis-of-eurusd-dated-31-03-2016/

Wednesday, March 30, 2016

Technical analysis of USDCAD dated 30.03.2016

USDCAD had an early decline yesterday but today it tried to rebound until it fell again later. The pair is going down the descendant channel not creating a clear pattern. All the attentions at this moment are at the oil market which will influence this pair. If oil pulls back, it will push USDCAD to higher levels. The pair is finding support at 1.3017 with resistance at 1.3130 which are both below the pivot point at 1.3217. The MACD indicator is in negative territory showing the price consolidation and the RSI is below the 50 level. There is no trading recommendation for this pair now and traders need to wait for a better chart setup.

https://fxglory.com/technical-analysis-of-usdcad-dated-30-03-2016/

https://fxglory.com/technical-analysis-of-usdcad-dated-30-03-2016/
Technical analysis of USDCHF dated 30.03.2016

USDCHF went back to the levels before the shocking decision of SCB last year but it started falling again and is fluctuating in lower ranges. At the moment, the support is at 0.9625 and resistance at 0.9760. The price is going below the pivot point at 0.9715. The price is below the MA of 200 and it may break the 0.960 level. Moreover both MA 20 and MA 50 are showing a bearish pattern. The RSI is locating below 50 level and the MACD indicator is in negative territory showing a price decline. From the upside aspect, the resistance level breakout would complete the decline from 1.009 otherwise the price will continue its drop.

https://fxglory.com/technical-analysis-of-usdchf-dated-30-03-2016/

Technical analysis of GBPUSD dated 30.03.2016

Two important news factors will influence GBPUSD on coming days, Manufacturing PMI on Friday and the Bank of England chairman’s performance on Thursday. Early on Tuesday GBPUSD fell but rose to 1.4366 later therefore 1.4500 level is staying resistive and this level breakout will be a strong buy signal for traders. The pair is finding support at 1.43200 with resistance at 1.44000. The EMA 11 is currently above the EMA 50 and the RSI is above the level 50 confirming the price growth. Moreover the MACD indicator is in positive territory endorsing the bullish pattern. After the resistance level breakout at 1.44000 buyers can expect price growth and target 1.4480.

https://fxglory.com/technical-analysis-of-gbpusd-dated-30-03-2016/


Technical analysis of EURUSD dated 30.03.2016

Yesterday EURUSD had a small decline since USD gain momentum because of investors’ waiting for Yellen’s comments but rose again later. At the same time EUR was being supported by Draghi’s comments claiming that the rates are not going lower. EURUSD is finding support at 1.1260 and resistance at 1.1350 and it seems that the pair is testing the resistance level at 1.1350 and is moving above the EMA 50. If the price breaks this level it will go higher and even may reach 1.15000 accordingly. The MACD indicator is in positive territory showing a price growth. Buyers can target 1.1370 followed by 1.1450.

https://fxglory.com/technical-analysis-of-eurusd-dated-30-03-2016/

https://fxglory.com/technical-analysis-of-eurusd-dated-30-03-2016/

Tuesday, March 29, 2016

Technical analysis of NZDUSD dated 29.03.2016

The NZDUSD is moving around the weekly pivot line at 0.6717 which is the support level as well and probably keeps going up and down around this area above the EMA 50. The pair is likely to move upward reaching 0.7000 as the next target. Long positions are recommended when the price hit 0.6770 and considering this scenario, the price will climb up the chart otherwise it will decline to 0.6666


https://fxglory.com/technical-analysis-of-nzdusd-dated-29-03-2016/

https://fxglory.com/technical-analysis-of-nzdusd-dated-29-03-2016/
Technical analysis of AUDUSD dated 29.03.2016

Today AUDUSD had a sharp fall but now it is staying neutral. Further rise is expected to push the price to 0.7849. Despite the fact that AUDUSD is going down the descendant channel in long term basis it might reach the channel roof for today. While keeping its bullish bias, the price is fluctuating above the pivot line at 0.7500 and MA of 20. The MACD indicator is in negative territory showing the price correction. Long positions are recommended targeting 0.7570 and 0.7610. If the price falls under the pivot line, short positions are recommended targeting 0.7475.

https://fxglory.com/technical-analysis-of-audusd-dated-29-03-2016/

https://fxglory.com/technical-analysis-of-audusd-dated-29-03-2016/
Technical analysis of USDJPY dated 29.03.2016

USDJPY is under the control of the Unemployment Rate, Household Spending y/y and Retail Sales y/y in Japan and S&P/CS Composite-20 HPI y/y and CB Consumer Confidence in US therefore the pair would act more volatile for today. The pair had a fall yesterday and now is finding support at 113.00 with resistance at 113.80. The price is above the Ichimoku Cloud and the Chinkou Span signaling a price growth. Tenkan-sen is showing upward trend and the Kijun-sen is showing horizontal trend. The MACD indicator is in positive territory confirming the buy signal. The expected price is the resistance breakout at 113.80 otherwise it will fall to 113.00.

https://fxglory.com/technical-analysis-of-usdjpy-dated-29-03-2016/

https://fxglory.com/technical-analysis-of-usdjpy-dated-29-03-2016/
Technical analysis of EURUSD dated 29.03.2016

EURUSD will be under the influence of news announcements such as M3 Money Supply y/y and Private Loans y/y for EUR and S&P/CS Composite-20 HPI y/y and CB Consumer Confidence for USD therefore this pair would be more volatile today. EURUSD is staying neutral for now and probably will move upward. The 1.13754 breakout will push the resistance towards 1.1713. Now the support resides at 1.1150 with resistance at 1.1260 and the price is climbing the ascendant channel above the SMA 20. The MACD indicator is also showing the price correction. Buyers can wait for the resistance breakout at 1.1260 and wait for the price expansion.

https://fxglory.com/technical-analysis-of-eurusd-dated-29-03-2016/

https://fxglory.com/technical-analysis-of-eurusd-dated-29-03-2016/


Monday, March 28, 2016

Technical analysis of Gold dated 28.03.2016


Since last week Gold has continued its downward trend targeting 1140 and 1100. It seems that this commodity is trading around 1215 at the moment but will fall to lower levels breaking 1190. The resistance level is staying at 1240 with support at 1212. Bearish trend is most likely for now but there will be a pullback pretty soon so buyers must be careful about their positions and can wait for the 1100 and 1150 to open their orders.


https://fxglory.com/technical-analysis-of-gold-dated-28-03-2016/

Technical analysis of USDCHF dated 28.03.2016

Bullard and Kaplan, Fed representatives, made comments about USDCHF suggesting that the price growth is prone to happen and they are trying to normalize the interest rates. The pair is expected to have a bullish trend for now moving within the descendant channel reaching 0.9780 and if it happens it will hit 0.9820. The price is finding support at 0.9685 with resistance level at 0.9820 moving above the pivot point at 0.9720. The MACD indicator is in positive territory showing the price consolidation. The RSI is staying above the 50.00 level and the price is fluctuating above the MA 20. The buyers can wait for the 0.9850 breakout for future expansion.

https://fxglory.com/technical-analysis-of-usdchf-dated-28-03-2016/

https://fxglory.com/technical-analysis-of-usdchf-dated-28-03-2016/
Technical analysis of USDJPY dated 28.03.2016

The meeting of Bank of Japan left a negative impact on JPY and on the other hand, the US will release some economic data such as Personal Spending m/m, the Core PCE Price Index m/m, the Goods Trade Balance and Pending Home Sales m/m, however, USDJPY will be less volatile today. The support resides at 113.00 with resistance at 113.80 near the 50% retracement of Fibonacci level. The price has been moving around the neutral zone since first days of February and now USDJPY is expected to have a bullish trend. The MACD indicator is in positive territory showing the price consolidation and the RSI indicator is also confirming the price growth. Buyers can target the resistance level breakout at 113.80 but in terms of the downtrend movement the support may reach 112.00.

https://fxglory.com/technical-analysis-of-usdjpy-dated-28-03-2016/

https://fxglory.com/technical-analysis-of-usdjpy-dated-28-03-2016/

Technical analysis of GBPUSD dated 28.03.2016

GBPUSD is under the influence of many news factors such as Retail Sales ex-Fuel report, Brexit, hawkish talk from Fed officials and the closing of major markets in Europe for Easter. Support is resting at 1.4160 with resistance at 1.4240. Over the last ten days the price has been moving within the descendant channel marked in the chart and there is good chance that it continues its downward trend. The MACD indicator is in negative territory showing the price consolidation and the RSI indicator is below 50 suggesting a price decline. Moreover the EMA 11 is below the EMA 56 confirming the price fall. If the support at 1.4160 is broken, it will go lower and reach 1.4000.

https://fxglory.com/technical-analysis-of-gbpusd-dated-28-03-2016/

https://fxglory.com/technical-analysis-of-gbpusd-dated-28-03-2016/
Technical analysis of EURUSD dated 28.03.2016

Last Friday’s US announcement of the latest version of Q4 2015 GDP along with China’s industrial growth are keeping the USD a favorite currency. ECB, on the other hand, is reaching its limits in terms of its effectiveness.
As shown in the chart, EURUSD is hanging around the 61.8% retracement at 1.1163 creating a neutral zone. Although the price is above the SMA of 100, it had been falling for the last recent days. For SMA 20 the price is trying to reach the line at 1.1170. The MACD indicator is showing a price consolidation since it is in a negative territory. The RSI shows that the price is going to stop its bearish movement and let the bears show up.
Buyers need to wait for the 1.1260 breakout and then observe a price growth otherwise the price may go down to 1.1050

https://fxglory.com/technical-analysis-of-eurusd-dated-28-03-2016/

https://fxglory.com/technical-analysis-of-eurusd-dated-28-03-2016/
Technical analysis of USDCHF dated 25.03.2016


US housing market data left a positive impact on USD along with the Federal Reserve representatives’ notes. Moreover the demand for safe assets has increased after the tragic events in Brussels. Despite all these, the dollar growth has stopped. In USDCHF chart for H4, the EMA 56 is standing above the EMA 11 which may suggest the price growth after those sudden declines. MACD indicator is in the neutral zone suggesting a price correction.
The break of 0.9850 is good sign for buyers which will push the price towards 0.9960. Otherwise, if the price fluctuate around 0.9660, it may fall and reach 0.9580.

https://fxglory.com/technical-analysis-of-usdchf-dated-25-03-2016/

https://fxglory.com/technical-analysis-of-usdchf-dated-25-03-2016/
Technical analysis of GBPUSD dated 25.03.2016

GBP is gaining momentum when the UK government bonds yields surpassed its counterparts as the US and Germany. On the other hand, the risk appetite has increased leaving impacts on this asset. At the moment GBPUSD is going downward and continuing the decline. Moreover the Ichimoku indicator is also signaling sell opportunity as the price s under the Ichimoku Cloud and the Chinkou Span. The Kijun-sen is showing a downward trend while the Tenkan-sen is showing horizontal movement. Likewise, the MACD indicator is in negative territory which means the price is correcting. The resistance level breakout at 1.42000 can smooth the way for buyers but for now the price is getting closer to the support level at 1.4093 maintaining its downward trend.


https://fxglory.com/technical-analysis-of-gbpusd-dated-25-03-2016/

https://fxglory.com/technical-analysis-of-gbpusd-dated-25-03-2016/
Technical analysis of EURUSD dated 25.03.2016

EUR was affected by the Thursday news about the German GfK consumer drop and income expectation decline. German economy is getting a key factor in EUR actions these days. Furthermore, US dollar was higher on Thursday after the unemployment rate decrease while the Markit Services PMI went above 50.
EURUSD declined yesterday and is fluctuating under the moving average of 10 day making resistance at 1.1195 and support at 1.1050. The H4 chart is showing that this pair is testing the roof of the descendant channel as marked in blue.The indicators are staying in negative territory suggesting the bearish trend. Sellers can still open their positions and those who opened their short positions due to our analysis yesterday can keep them open.

https://fxglory.com/technical-analysis-of-eurusd-dated-25-03-2016-2/

https://fxglory.com/technical-analysis-of-eurusd-dated-25-03-2016-2/
 Technical analysis of GBPUSD dated 24.03.2016

Still under the pressure of Brexit, Consumer Price Index also affected GBP in February. GBPUSD had a decline for today and found support at 1.41. Deciding on this pair is tricky for today and traders can wait for better chart settings to make up their minds. The Ichimoku is showing a strong sell signal since the price is under the Ichimoku Cloud and the Chinkou Span. The Kijun-sen shows a horizontal trend while the Tenkan-sen shows a fall. Furthermore the MACD indicator is in negative territory confirming the price decrease. Sellers can target the support level at 1.4000.

https://fxglory.com/technical-analysis-of-gbpusd-dated-24-03-2016/


https://fxglory.com/technical-analysis-of-gbpusd-dated-24-03-2016/
Technical analysis of Silver dated 24.03.2016

Yesterday silver had a sharp decline reaching the support level at 15.20. The support level is changing to 15.00 which signals a downward trend for silver at the moment. Considering the chart, it can be anticipated that the top has already been formed at 15.30 for today and bears are not going to give their place to bulls. This fall may continue even to 14.50 but if it does then bulls will take the control of the chart.
Sellers can have their positions opened until the price reaches 15.00 followed by 14.50. When the price reaches 14.50 it will be time for buyers to join the trade.

https://fxglory.com/technical-analysis-of-silver-dated-24-03-2016/

https://fxglory.com/technical-analysis-of-silver-dated-24-03-2016/
Technical analysis of USDJPY dated 24.03.2016

USDJPY will be under the influence of BOJ Summary of Opinions and the US releasing economic data such as the Flash Services PMI, Durable Goods Orders m/m, Natural Gas Storage, Core Durable Goods Orders m/m and Unemployment Claims therefore it would be more volatile today. The first support rests at 112.20 followed by 111.40. The first resistance resides at 113.00 leading to 113.80. The MACD is indicating a price correction since the price is in neutral territory.
Long positions are recommended targeting 112.95 followed by 113.30. However, if the price falls under the pivot line sellers can target 111.75. If the downward break happened the pair will continue its decline targeting 110.35.

https://fxglory.com/technical-analysis-of-usdjpy-dated-24-03-2016/
Technical analysis of EURUSD dated 24.03.2016

The European asset gain momentum when Germany 10 years government bonds yield surpassed its rivals (the US and the UK). However, the risk appetite increased which leaves a negative impact on euro. Therefore EURUSD is staying neutral at this moment. The support levels are 1.1150 and 1.1057 followed by resistance at 1.1260 and 1.1350. As long as support stays at 1.1057, EURUSD will have upward trend. Considering the growth scenario, a strong resistance would rest around 38.2% retracement of 1.3993 to 1.0461 and on the other hand below 1.1057 the support will reach 1.0820. The MACD indicator is in neutral territory signaling a price decline.
Short positions are recommended while price is moving around 1.1350 – 1.1400 area. Buyers can wait for the price to reach 1.1000 and set SL at 1.0940.

https://fxglory.com/technical-analysis-of-eurusd-dated-24-03-2016/


https://fxglory.com/technical-analysis-of-eurusd-dated-24-03-2016/


Technical analysis of USDCAD dated 23.03.2016

USDCAD had a slight increase on Monday but it fell again. Now this pair’s action depends on oil. If oil declines it will give power to the market to grow. The price is fluctuating within a tight channel in the bearish zone leading upward. The price must break the resistance at 1.31700 to confirm the low as the bottom price and enter the neutral zone. Now the support lies at 1.3020 and resistance at 1.31700 but if the price rallies upward, the support and resistance zone will change to higher ranges. Due to the MACD indicator, the price is in positive territory signaling buy positions since the price is correcting.

https://fxglory.com/technical-analysis-of-usdcad-dated-23-03-2016/


https://fxglory.com/technical-analysis-of-usdcad-dated-23-03-2016/

Technical analysis of USDCAD dated 23.03.2016

USDCAD had a slight increase on Monday but it fell again. Now this pair’s action depends on oil. If oil declines it will give power to the market to grow. The price is fluctuating within a tight channel in the bearish zone leading upward. The price must break the resistance at 1.31700 to confirm the low as the bottom price and enter the neutral zone. Now the support lies at 1.3020 and resistance at 1.31700 but if the price rallies upward, the support and resistance zone will change to higher ranges. Due to the MACD indicator, the price is in positive territory signaling buy positions since the price is correcting.

https://fxglory.com/technical-analysis-of-usdcad-dated-23-03-2016/

https://fxglory.com/technical-analysis-of-usdcad-dated-23-03-2016/
Technical analysis of EURUSD dated 23.03.2016

Today EURUSD is under the influence of the European market and US announcements such a German 30-y Bond Auction, Manufacturing PMI and US economic data therefore this pair will be more volatile. EURUSD is falling within the descending channel however breaking the resistance at 1.1253 can initiate its upward rally. As the support is resting at 1.1182 the price is getting closer to break it and move it to 1.1100. The Ichimoku indicator is showing a strong buy signal. The price is above the Ichimoku Cloud and the Chinkou Span and the Tenkan-sen is showing a horizontal movement while the Kijun-sen is showing upward movement. The price is in positive territory for MACD proving that the price is correcting. If the price declines it will reach 1.1150 and 1.1050 otherwise it will go upward to 1.1260, 1.1350.

https://fxglory.com/technical-analysis-of-eurusd-dated-23-03-2016-2/

https://fxglory.com/technical-analysis-of-eurusd-dated-23-03-2016-2/
 
Technical analysis of GBPUSD dated 23.03.2016

While Brexit is still putting pressure on GBP, British Minister for Labour Affairs and Pensions resigned from his position and this event will definitely influence GBP as well. Due to the CBI report, the Britain’s exit from EU will increase the unemployment rate. Now GBPUSD is fluctuating around the support level at 1.4160 and the break of this level shows that the corrective rebound has completed. On the other hand, the break of 1.45111 may lead the price up but it will eventually fall back with resistance at 1.4667 which is now at 1.4240. Considering previous price movement, the fall from 1.7190 indicates more declines even to 1.3503. Furthermore, MACD is in a negative territory signaling the price fall. Sellers can enjoy the price decrease with new support at 1.4080.

https://fxglory.com/technical-analysis-of-gbpusd-dated-23-03-2016/

https://fxglory.com/technical-analysis-of-gbpusd-dated-23-03-2016/
Technical analysis of Gold dated 22.03.2016

Gold broke the short term bearish channel and is fluctuating now but may go higher to 1300. At this H4 chart the stochastic oscillator is overvalued. Price is moving around the bearish channel. Now the support lies at 1240 which might change soon if the price hit 1300$. Although in short term bulls may push the price to grow, a reverse to 1170 and 1100 is still expected. As the yesterday’s price fall was due to the strong USD, there is a slight chance that bulls stay active for now. Traders can go for short positions around 1250 and target 1190 while setting SL at 1273.

https://fxglory.com/technical-analysis-of-gold-dated-22-03-2016/

https://fxglory.com/technical-analysis-of-gold-dated-22-03-2016/


Technical analysis of USDJPY dated 22.03.2016

Many news factors affect USDJPY today such as US stocks, the S&P 500, the Dow Jones Industrial Average and Nasdaq Composite. Additionally the USD was supported by some Federal Reserve presidents who revealed another interest growth in April. USDJPY is expected to grow and reach higher ranges above 112.39 targeting 112.52 which will signal a sell opportunity at that moment that may drop to 110.71. Currently bulls are pushing the price towards the 112.52 or 112.58 level and the MA of 20 is also supporting this idea. Long positions are recommended after the 112.52 breakout otherwise go short with a target at 110.71.

https://fxglory.com/technical-analysis-of-usdjpy-dated-22-03-2016/


https://fxglory.com/technical-analysis-of-usdjpy-dated-22-03-2016/

Technical analysis of EURUSD dated 22.03.2016

Being influenced by the ECB Representative, Euro rate started falling on Monday. EURUSD had a decline on Monday after reaching 1.13423 on Friday moreover the RSI indicator is signaling a correlation. Bulls are targeting 1.1400 and for tomorrow it will climb the ascending channel. The support is resting at 1.1196 with resistance at 1.1270.
The Ichimoku indicator is also showing a buy signal with the price above the Ichimoku Cloud and the Chinkou Span. The Tenkan-sen and the Kijun-sen are signaling a horizontal movement. Furthermore the MACD is in positive territory supporting the price growth. A breakout from 1.1260 is a strong buy signal for buyers targeting 1.1350.

https://fxglory.com/technical-analysis-of-eurusd-dated-22-03-2016/

Thursday, March 17, 2016

Technical analysis of Gold dated 17.03.2016

Gold had a sudden bounce to 1264.02 yesterday and today moved back a little towards the Fibonacci retracement level at 50% from the most recent high to the most recent low. There is a bearish reversal that may happen pretty soon and the decline will probably continue to $1190.00 at least. The price is above the Ichimoku Cloud at 61.8% Fibonacci retracement level. Tenkan-Sen and Kijun-Sen are signaling downward trend. Sell positions are recommended at the moment with the target of 1190.00.

https://fxglory.com/technical-analysis-of-gold-dated-17-03-2016/

https://fxglory.com/technical-analysis-of-gold-dated-17-03-2016/
Technical analysis of GBPUSD dated 17.03.2016

Apart from the Brexit which has devalued GBP, the United Kingdom failed to surpass its counterparts, the US and Germany, in government bonds yields which weakens GBP as well. However, despite all the difficulties, GBPUSD is showing signs of price growth and for tomorrow all eyes will be on the British Central Bank meeting.
GBPUSD have had a bullish tendency above 1.4000 and is moving around the SMA of 200.The MACD indicator is also showing the bullish tendency at positive territory.
As the support lies at 1.42240 and resistance at 1.42700 there is a good chance that pair breaks the resistance level and reach 1.4310. Buyers can wait for the resistance breakout and then open their positions to target 1.4310.

https://fxglory.com/technical-analysis-of-gbpusd-dated-17-03-2016/

https://fxglory.com/technical-analysis-of-gbpusd-dated-17-03-2016/
Technical analysis of EURUSD dated 17.03.2016

EURUSD has a sudden bullish trend yesterday. EUR was under the influence of Federal Reserve’s meeting results publication and the government bonds yields which in comparison with the US and Germany had a decline.
At the moment support lies at 1.1227 and resistance at 1.1289. The resistance zone may reach 1.1300 and a breakout from this area can push the price to the neutral zone around 1.1100. As the MACD indicator is in a positive territory the price is expanding. Buyers need to wait for the resistance breakout and after that target 1.13390.

https://fxglory.com/technical-analysis-of-eurusd-dated-17-03-2016/

https://fxglory.com/technical-analysis-of-eurusd-dated-17-03-2016/
Technical analysis of USDJPY dated 17.03.2016

Despite the fact that USDJPY was supposed to gain momentum after keeping the current monetary policy unchanged by the Bank of Japan, it moved downward. USD, on the other hand, had been affected by the published consumer price index for February. Considering the MA 200, the price had tried to cross the line but there is no sign of following it and bears are about to show up since the price is creating lower lows and lower highs.
Now the support level is resting at 111.90 with the resistance at 112.700. There is a sell signal on MACD and Ichimoku indicator. The price is under the Ichimoku Cloud and the Chinkou Span. The Tenkan-sen and the Kijun-sen both are indicating downward trend.
Sellers can open their orders at any price around the resistance level targeting the next support level at 111.150.

https://fxglory.com/technical-analysis-of-usdjpy-dated-17-03-2016/

https://fxglory.com/technical-analysis-of-usdjpy-dated-17-03-2016/

Technical analysis of NZDUSD dated 16.03.2016

NZDUSD is falling down along with the MA of 20 and 50 and it is not showing any signs of gaining momentum. Now the support is resting at 0.6600 and 0.6535 with the resistance at 0.6650 and 0.6750. If the price fails to break the resistance at 0.66500 it will continue its decline up to 0.6570. The price is fluctuating below the pivot line at 0.6660 which signals the bearish trend for the coming hours. Short positions are recommended targeting 0.6570 which may even go lower to 0.6540. However, if the bulls appear, the price will jump higher than the pivot point. Buyers can wait for the price to reach the pivot point and then target 0.6705 followed by 0.6730.

https://fxglory.com/technical-analysis-of-nzdusd-dated-16-03-2016/

https://fxglory.com/technical-analysis-of-nzdusd-dated-16-03-2016/
Technical analysis of USDCHF dated 16.03.2016

Today CHF stays neutral for news but USD is about to be effected by the release of Building Permits and CPI data and Crude Oil Inventories followed by FOMC publishing the commencing. Yesterday the price touched 0.9895 creating a short term sell opportunity but it bounced back to 0.9900 today. Now the trend is hanging in 0.98600 and 0.98900 area and has not determined its bullish or bearish tendency but the support levels are at 1.9845 and 0.9800 with resistance of 0.9895 and 0.9950.
If the price breaks the support at 0.9800, it may fall and drop to 0.9660 and on the upside, if the price touches 1.0091 it will change the resistance zone to 1.0225 and 1.0327. While USDCHF is being supported by the 55 weeks EMA, it is better to stay neutral at this moment. If traders insist on USDCHF, they can open their long position when the price reached 0.9800 or go short when the price reached 0.9891 and 0.9903 area.

https://fxglory.com/technical-analysis-of-usdchf-dated-16-03-2016/
 
Technical analysis of EURUSD dated 16.03.2016

Today EURUSD is under the influence of economic news such as FOMC Statement, the Federal Funds Rate, German 10-y Bond Auction and Capacity Utilization Rate, therefore high volatility is expected for today’s EURUSD chart. The price is consolidating with 1.1230 and 1.810 in the coming hours finding support at 1.1070 and 1.1020 with the resistance at 1.1130 and 1.1220.
The indicators are in positive area for now and MACD is indicating a price growth. The price is above the Ichimoku Cloud and the Chinkou Span. The Kijun-sen signals a horizontal movement while the Tenkan-sen shows a downward trend.

https://fxglory.com/technical-analysis-of-eurusd-dated-16-03-2016/

https://fxglory.com/technical-analysis-of-eurusd-dated-16-03-2016/
Technical analysis of GBPUSD dated 16.03.2016

While there is a possibility for United Kingdom to leave the European Union, this pair have been having bearish tendency. Still there would be more volatility for GBPUSD if Mark Carney announces negative comments regarding the UK economy. It fell yesterday testing the 1.4150 area and it may continue its decline for today as well.
Now the support lies at 1.4121 and resistance at 1.4136. Considering the Ichimoku indicator, the price is in the Ichimoku Cloud and above the Chinkou Span. The Kijun-sen is signaling a horizontal trend while the Tenkan-sen is showing downward trend. RSI and MACD are both indicating strong sell signal. Buyers can give themselves a rest while seller target 1.4080 and 1.4000 soon.

https://fxglory.com/technical-analysis-of-gbpusd-dated-16-03-2016/

https://fxglory.com/technical-analysis-of-gbpusd-dated-16-03-2016/

Tuesday, March 15, 2016

Technical analysis of USDJPY dated 15.03.2016

Today USDJPY is affected by several news factors from US and Japan. US is releasing the February’s retail sales report which is expected to grow. Moreover, the Empire State manufacturing along with NABH housing market index are about to publish their increasing rate. On the other hand, Japan will be announcing news regarding the BOJ Press Conference, Revised Industrial Production m/m and Tertiary Industry Activity m/m.
Now the first support lies at 113.00, the next is at 112.20. The first resistance resides at 113.80, the next one is at 114.60. There is a bearish pennant pattern shaped already in H4 which just needed to break down to confirm bearish trend, but as far as it will not show itself, pair will move within the triangle.

https://fxglory.com/technical-analysis-of-usdjpy-dated-15-03-2016/

https://fxglory.com/technical-analysis-of-usdjpy-dated-15-03-2016/

Technical analysis of GBPUSD dated 15.03.2016

As revenues are expected to expand this week, GBPUSD is still struggling with Brexit. Although the budget is not a major element for this pair, it may be influenced by the Bank of England’s comments about service sector.
GBPUSD has already touched the top at 1.44343 and have been fluctuating since then; therefore a rebound to 1.38350 is likely to happen. However, in terms of the price growth, the strong resistance would be at 1.4400 and looking from the downside, the support will be at 1.4240. The ascending channel has been punched in support and it may guide pair to change the trend to a bearish one but it needs to be confirmed and confirmation will be a little moving upward to test support line of channel as a resistance and then be bearish again.

https://fxglory.com/technical-analysis-of-gbpusd-dated-15-03-2016/

https://fxglory.com/technical-analysis-of-gbpusd-dated-15-03-2016/
Technical analysis of USDCHF dated 14.03.2016

Last Friday there were no major economic news for USDCHF therefore it was chiefly under the influence of the world’s leading stock exchanges. However USD was supported by the US Labor Department releasing the Initial Jobless Claims. While maintaining its bearish trend, USDCHF have found support at 0.9875 and resistance at 0.9940.
Due to the Ichimoku indicator, the price is below the Cloud while the Tenkan-sen and the Kijun-sen are both signaling a horizontal movement. Moreover, the MACD is in negative territory showing the same prediction. A bearish trend is expected for this pair and sellers can open their positions with the first target at 0.9755.

https://fxglory.com/technical-analysis-of-usdchf-dated-14-03-2016/

https://fxglory.com/technical-analysis-of-usdchf-dated-14-03-2016/
Technical analysis of EURJPY dated 14.03.2016

On Friday EURJPY had been fluctuating creating neutral candles. There is a slight chance for price to reach 120.50 and expand to 130 therefore it may attract buyers. Now the support levels are at 122.88, 123.39 and 124.23 and resistance levels at 125.57, 126.08 and 127.38. There is still one wave to complete the correction of the bullish rally. However, it is better to stay short as bears are about to take the control of the trend.

https://fxglory.com/technical-analysis-of-eurjpy-dated-14-03-2016/

https://fxglory.com/technical-analysis-of-eurjpy-dated-14-03-2016/

Technical analysis of EURUSD dated 14.03.2016

 Technical analysis of EURJPY dated 14.03.2016

As the market is still shocked by the ECB results, the ECB predicted a lower inflation for this year and Monetary authorities announced that this year there will be no threat for deflation. Today the US is not releasing any economic data therefore EURUSD will be under the influence of European Market for Today.
In EURUSD chart of H4 the pivot line is marked at 1.1132 following the support which lies at 1.1098 and resistance at 1.1151. The market is signaling a strong buy opportunity and it seems that it may even break 1.15 level. The Ichimoku indicator is also showing the same signal with the price locating above the Ichimoku Cloud and Chinkou Span. While Kijun-sen is showing a horizontal movement, the Tenkan-sen is indicating an upward trend. MACD indicator is showing a price growth as well.
Buyers can mark this moment as their best trading opportunity. However there might be a correction to 1.1050.

https://fxglory.com/technical-analysis-of-eurusd-dated-14-03-2016/

https://fxglory.com

Friday, March 11, 2016

Technical analysis of GBPUSD dated 11.03.2016

Pound is in a critical moment right now and probability of the England exit from the European Union will apply more pressure on this currency. Now the support level for GBPUSD is settling around 1.4235 and 1.4120 and the resistance at 1.4320 and 1.4380.
Yesterday’s price growth cheered up buyers and may continue its growth to 1.4350-55 as well which is the 61.8% Fibonacci retracement of 1.4669-1.3836. The Ichimoku indicator is still signaling a strong buy opportunity as the price is above both the Ichimoku Cloud and the Chinkou Span and both Tenkan-sen and Kijun-sen are pointing an upward trend.

Technical analysis of GBPUSD