
Wednesday, May 31, 2017
USDJPY analysis for 31.05.2017
Japan is releasing Housing Starts y/y and Prelim Industrial Production m/m data along with the US publishing Beige Book, Pending Home Sales m/m and Chicago PMI reports.
The support rests at 110.710 with resistance at 111.190 which both lines are below the weekly pivot point at 111.430. The EMA of 10 is moving with bearish bias along the descendant channel and it is below the EMA of 100 and above the EMA of 200. The RSI is moving below the 50 level, the Stochastic is showing upward momentum and the MACD indicator is in negative territory. The ADX is not showing any clear signals.
It seems that the pair will continue its bearish trend targeting 110 ar
https://fxglory.com/usdjpy-analysis-for-31-05-2017/

GOLD analysis for 31.05.2017
Gold price is chiefly under the influence of some economic data such as Conference Board’s Consumer Confidence and August Comex gold futures.
The support rests at 1259.89 with resistance at 1264.70 which the weekly pivot point at 1261.67 is located in between the lines. The EMA of 10 is moving with bearish bias and it is above the EMA of 200 and the EMA of 100. The RSI is moving horizontally on the 50 level, the Stochastic is showing upward momentum and the MACD indicator is in neutral territory. The ADX is not showing any clear signals. The price is above the Ichimoku Cloud and below the Chinkou Span. The Tenkan-sen is showing a horizontal trend while the Kijun-sen is showing an upward trend.
Short positions are recommended targeting 1258.
https://fxglory.com/gold-analysis-for-31-05-2017/


EURUSD analysis for 31.05.2017
Draghi’s comments did not leave any impact on EURUSD however, the PCE data came out for the US, putting this currency under pressure.
The support rests at 1.11680 with resistance at 1.12230 which the weekly pivot point at 1.12020 is located in between the lines. The EMA of 10 is moving with bullish bias along the ascendant channel and it is above the EMA of 100 and the EMA of 200. The RSI is moving on the 50 level, the Stochastic is showing downward momentum and the MACD indicator is in negative territory. The ADX is not showing any clear signals.
Long positions are recommended targeting 1.13.
https://fxglory.com/eurusd-analysis-for-31-05-2017/


Tuesday, May 30, 2017
NZDUSD analysis for 30.05.2017
While the US is publishing Core PCE Price Index and Personal Spending reports, NZDUSD is also under the influence of Draghi’s announcement regarding Euro Zone requirement for stimulus.
The support rests at 0.70300 with resistance at 0.70660 which both lines are above the weekly pivot point at 0.70140. The EMA of 10 is moving with bullish bias along the ascendant channel and it is above the EMA of 100 and 200. The RSI is moving horizontally on the 50 level, the MACD indicator is in positive territory and the Stochastic is moving in low ranges. The ADX is not showing any clear signals. The price is above the Ichimoku Cloud and the Chinkou Span. The Tenkan-sen and the Kijun-sen are both showing a horizontal trend.
The resistance level breakout will be a good sign for buyers to target 0.71 area otherwise, the pair will drop to 0.70
https://fxglory.com/nzdusd-analysis-for-30-05-2017/


GBPUSD analysis for 30.05.2017
There are no economic reports in the Great Britain however the US is publishing Core PCE Price Index and Personal Income and Spending Reports.
The support rests at 1.27970 with resistance at 1.28510 which both lines are below the weekly pivot point at 1.28730. The EMA of 10 is moving with bearish bias along the descendant channel and it is below the EMA of 200 and the EMA of 100. The RSI is rising towards the 50 level, the Stochastic is moving in low ranges and MACD indicator is in negative territory. The ADX is showing sell signals.
GBPUSD has already started its correction pattern therefore the price growth will continue towards the 61.8 level of Fibonacci retracement.
https://fxglory.com/gbpusd-analysis-for-30-05-2017/


EURUSD analysis for 30.05.2017
EURUSD is chiefly under the influence of economic reports such as Business Confidence reports in Eurozone and Personal Income and Spending Reports in the US.
The support rests at 1.11090 with resistance at 1.11390 which both lines are below the weekly pivot point at 1.12020. The EMA of 10 is moving with bearish bias along the bearish channel and it is above the EMA of 100 and the EMA of 200. The RSI is moving in oversold area, the Stochastic is moving in low ranges while showing upward momentum and the MACD indicator is in neutral territory. The ADX is showing sell signals.
The 1.11 level seems to be supportive therefore EURUSD will start its correction pattern soon growing towards 1.14 area.
https://fxglory.com/eurusd-analysis-for-30-05-2017/


USDJPY analysis for 29.05.2017
There are no economic reports in the US and Japan to influence USDJPY.
The support rests at 110.990 with resistance at 111.590 which the weekly pivot point at 111.340 is located in between the lines. The EMA of 10 is moving with bearish bias along the descendant channel and it is below the EMA of 100 and above the EMA of 200. The RSI is moving below the 50 level, the Stochastic is showing upward momentum and the MACD indicator is in neutral territory. The ADX is not showing any clear signals.
USDJPY seems too weak to break the resistance line therefore short positions are recommended at the moment.
https://fxglory.com/usdjpy-analysis-for-29-05-2017/


USDCAD analysis for 29.05.2017
CAD is supported by the oil price.
The pair is finding support at 1.34380 with resistance at 1.34730 which both lines are below the monthly pivot point at 1.35210. The EMA of 10 is moving with bullish and it is located below the EMA of 200 and below the EMA of 100. The RSI is falling towards the oversold area, the MACD indicator is in negative territory and the Stochastic is showing upward momentum. The ADX is not showing any clear signals. The price is below the Ichimoku Cloud and above the Chinkou Span. The Tenkan-sen is showing an upward momentum while the Kijun-sen is showing a horizontal trend.
There are no economic reports in Canada and the US therefore the pair will be consolidating around 1.34 are
https://fxglory.com/usdcad-analysis-for-29-05-2017/


EURUSD analysis for 29.05.2017
EURUSD is not going to be volatile due to holiday in China, UK and the US for different reasons.
The support rests at 1.11490 with resistance at 1.12070 which the weekly pivot point at 1.11910 is located in between the lines. The EMA of 10 is moving with bearish bias and it is above the EMA of 100 and the EMA of 200. The RSI is rising towards the 50 level, the Stochastic is moving in low ranges and the MACD indicator is in neutral territory. The ADX is not showing any clear signals.
There are no enough signals for traders to make up their minds therefore it’s better to wait for better signals.
https://fxglory.com/eurusd-analysis-for-29-05-2017/


Friday, May 26, 2017
NZDUSD analysis for 26.05.2017
There are no important economic reports in New Zealand therefore NZDUSD is chiefly under the influence of economic reports in the US such as Durable Goods Orders and GDP Growth Rate.
The support rests at 0.70230 with resistance at 0.70570 which both lines are above the weekly pivot point at 0.69070. The EMA of 10 is moving with bullish bias along the ascendant channel and it is above the EMA of 100 and 200. The RSI is moving in overbought area, the MACD indicator is in positive territory and the Stochastic is showing upward momentum. The ADX is not showing any clear signals. The price is above the Ichimoku Cloud and the Chinkou Span. The Tenkan-sen is showing a horizontal trend while the Kijun-sen is showing an upward trend.
Indicators are showing upward momentum therefore buyers can target 0.71 in case of price growth.
https://fxglory.com/nzdusd-analysis-for-26-05-2017/


GBPUSD analysis for 26.05.2017
It seems that GBPUSD is going to stay volatile due to some economic reports such as second estimate GDP data from the UK and the unemployment claims data from the US.
The support rests at 1.28600 with resistance at 1.29050 which both lines are below the weekly pivot point at 1.29810. The EMA of 10 is moving with bearish bias along the descendant channel and it is above the EMA of 200 and below the EMA of 100. The RSI is rising towards the 50 level, the Stochastic is moving in low ranges and MACD indicator is in negative territory. The ADX is showing sell signals.
The support area is too strong to be broken therefore buyers can target 1.3030.
https://fxglory.com/gbpusd-analysis-for-26-05-2017/


EURUSD analysis for 26.05.2017
The US is publishing durable goods data and the Preliminary GDP data and the Eurozone has released Business Confidence and Consumer Confidence.
The support rests at 1.11740 with resistance at 1.12330 which both lines are above the weekly pivot point at 1.11130. The EMA of 10 is moving with bullish bias along the ascendant channel and it is above the EMA of 100 and the EMA of 200. The RSI is rising towards the overbought area, the Stochastic is showing upward momentum and the MACD indicator is in positive territory. The ADX is not showing any clear signals.
Long positions are recommended targeting 1.1260.
https://fxglory.com/eurusd-analysis-for-26-05-2017/


Gold analysis for 25.05.2017
Fed Meeting Minutes which was released late Wednesday influenced Gold along with Non-Farm Payrolls and inflation reports in the US.
The support rests at 1255.07 with resistance at 1261.59 which both lines are above the weekly pivot point at 1248.47. The EMA of 10 is moving with bearish bias and it has passed the EMA of 200 but they are both above the EMA of 100. The RSI is moving horizontally above the 50 level, the Stochastic is showing upward momentum and the MACD indicator is in neutral territory. The ADX is not showing any clear signals. The price is above the Ichimoku Cloud and below the Chinkou Span. The Tenkan-sen and the Kijun-sen are both showing a horizontal trend.
Long positions are recommended targeting 1268.30.
https://fxglory.com/gold-analysis-for-25-05-2017/


GBPUSD analysis for 25.05.2017
GBPUSD is under the influence of estimate GDP data from the UK and the unemployment claims data from the US.
The support rests at 1.29640 with resistance at 1.29960 which the weekly pivot point at 1.29810 is located in between the lines. The EMA of 10 is moving with bullish bias along the ascendant channel and it is above the EMA of 200 and the EMA of 100. The RSI is moving on the 50 level, the Stochastic is showing upward momentum and MACD indicator is in neutral territory. The ADX is showing buy signals.
Long positions are recommended targeting 1.30.
https://fxglory.com/gbpusd-analysis-for-25-05-2017/


EURUSD analysis for 25.05.2017
Today there are no important economic data in Eurozone however the US is publishing unemployment claims data.
The support rests at 1.12080 with resistance at 1.12600 which both lines are above the weekly pivot point at 1.11130. The EMA of 10 is moving with bullish bias along the ascendant channel and it is above the EMA of 100 and the EMA of 200. The RSI is falling towards the 50 level, the Stochastic is moving in high ranges and the MACD indicator is in positive territory. The ADX is not showing any clear signals.
The 1.126 level seems to be a strong resistance area therefore short positions are recommended targeting 1.11.
https://fxglory.com/eurusd-analysis-for-25-05-2017/


Wednesday, May 24, 2017
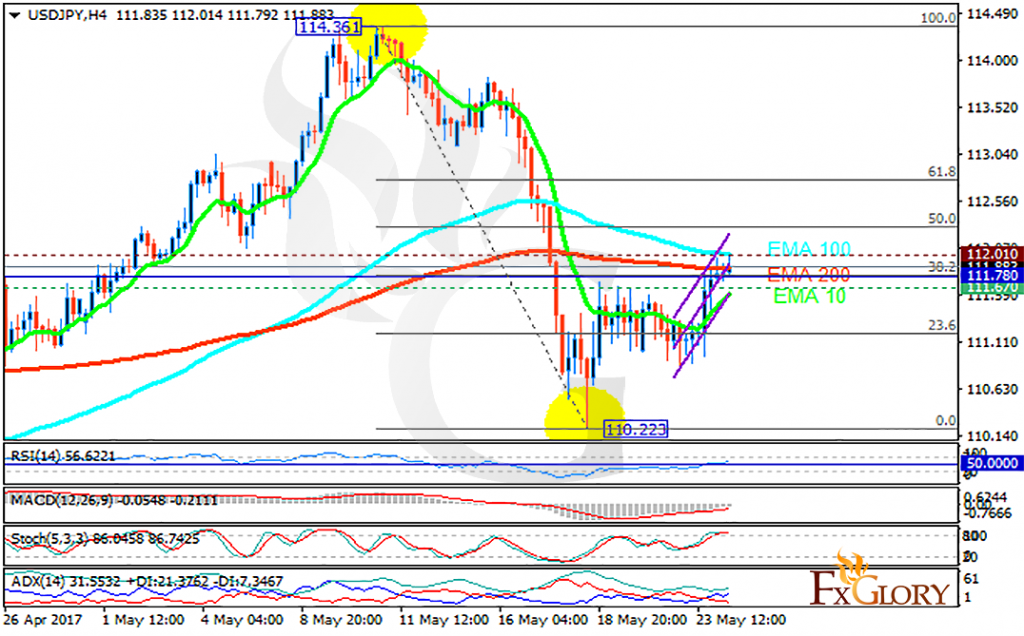
USDJPY analysis for 24.05.2017
Japan has released Flash Manufacturing PMI data and the US will publish FOMC Meeting Minutes, Crude Oil Inventories, Existing Home Sales and HPI m/m.
The support rests at 111.670 with resistance at 112.010 which the weekly pivot point at 111.780 is located in between the lines. The EMA of 10 is moving with bullish bias along the ascendant channel but it is below the EMA of 100 and the EMA of 200. The RSI is rising above the 50 level, the Stochastic is moving in high ranges and the MACD indicator is in neutral territory. The ADX is showing buy signals.
It seems that the pair has started its correction pattern targeting the 50 level of Fibonacci at 112.5.
https://fxglory.com/usdjpy-analysis-for-24-05-2017/

USDCAD analysis for 24.05.2017
USDCAD is chiefly under the influence of BoC Interest Rate Decision in Canada and Existing Home Sales along with the FOMC Minutes reports in the US.
The pair is finding support at 1.35020 with resistance at 1.35540 which both lines are below the weekly pivot point at 1.35790. The EMA of 10 is moving with bullish bias along the ascendant channel but it is below the EMA of 100 and the EMA of 200. The RSI is moving horizontally on the 50 level, the MACD indicator is in negative territory and the Stochastic is moving in high ranges. The ADX is showing buy signals. The price is below the Ichimoku Cloud and the Chinkou Span. The Tenkan-sen and the Kijun-sen are both showing a horizontal trend.
The indicators are not showing any firm signals however, the support level breakthrough will smooth the way for further decline targeting 1.34 otherwise it will grow to 1.36.
https://fxglory.com/usdcad-analysis-for-24-05-2017/


EURUSD analysis for 24.05.2017
Fed’s decision regarding the rate hike can influence EURUSD today along with the FOMC meeting.
The support rests at 1.11600 with resistance at 1.12020 which both lines are above the weekly pivot point at 1.11130. The EMA of 10 is moving with bearish bias along the descendant channel but it is above the EMA of 100 and the EMA of 200. The RSI is moving horizontally on the 50 level, the Stochastic is moving in low ranges and the MACD indicator is in positive territory. The ADX is not showing any clear signals.
Short positions are recommended targeting 1.10.
https://fxglory.com/eurusd-analysis-for-24-05-2017/


Tuesday, May 23, 2017
USDCHF analysis for 23.05.2017
USDCHF has been falling down since the previous high around 1.00 level.
The support rests at 0.96940 with resistance at 0.97680 which both lines are below the weekly pivot point at 0.98200. The EMA of 10 is moving with bearish bias along the descendant channel and it is located below the EMA of 200 and above the EMA of 100. The RSI is moving in oversold area, the MACD indicator is in negative territory and the Stochastic is moving in middle ranges. The ADX is not showing any clear signals. The price is below the Ichimoku Cloud and the Chinkou Span. The Tenkan-sen and the Kijun-sen are both showing a downward trend.
Short positions are recommended targeting 0.9645.
https://fxglory.com/usdchf-analysis-for-23-05-2017/


GBPUSD analysis for 23.05.2017
GBPUSD has been choppy since the last month. There are no important economic reports in the Great Britain however the US is publishing New Home Sales and Markit Manufacturing PMI Flash.
The support rests at 1.29610 with resistance at 1.30110 which the weekly pivot point at 1.29040 is located in between the lines. The EMA of 10 is moving with bullish bias along the ascendant channel and it is above the EMA of 200 and the EMA of 100. The RSI is moving on the 50 level, the Stochastic is showing downward momentum and MACD indicator is in positive territory. The ADX is showing sell signals.
While noting that GBPUSD will remain choppy, buyers can target 1.31.
https://fxglory.com/gbpusd-analysis-for-23-05-2017/


EURUSD analysis for 23.05.2017
Europe has published some influential economic reports such as German Ifo Business Climate and the Flash PMI data from Germany and France along with the US releasing New Home Sales.
The support rests at 1.11780 with resistance at 1.12710 which both lines are above the weekly pivot point at 1.11130. The EMA of 10 is moving with bullish bias along the ascendant channel and it is above the EMA of 100 and the EMA of 200. The RSI is moving in overbought area, the Stochastic is moving in high ranges and the MACD indicator is in positive territory. The ADX is showing weak buy signals.
Long positions are recommended targeting 1.13 area.
https://fxglory.com/eurusd-analysis-for-23-05-2017/


Monday, May 22, 2017
USDJPY analysis for 22.05.2017
USDJPY is chiefly under the influence of some economic reports such as Balance of Trade in Japan and Fed Harker Speech in the US.
The support rests at 111.260 with resistance at 111.600 which both lines are below the weekly pivot point at 111.780. The EMA of 10 is moving horizontally below the EMA of 100 and the EMA of 200. The RSI is falling below the 50 level, the Stochastic is showing upward momentum and the MACD indicator is in negative territory. The ADX is not showing any clear signals.
Long positions are recommended targeting 112.
https://fxglory.com/usdjpy-analysis-for-22-05-2017/


NZDUSD analysis for 22.05.2017
NZDUSD has been fluctuating within the horizontal rectangle.
The support rests in 0.69240 with resistance at 0.69500 which both lines are above the weekly pivot point at 0.69070. The EMA of 10 is moving with bullish bias and it is above the EMA of 100 and below the EMA of 200. The RSI is moving horizontally in the overbought area, the MACD indicator is in positive territory and the Stochastic is moving in high ranges. The ADX is showing buy signals. The price is above the Ichimoku Cloud and the Chinkou Span. The Tenkan-sen and the Kijun-sen are both showing a horizontal trend.
The resistance level breakout will smooth the way for further growth otherwise NZDUSD will fall towards 0.6850.
https://fxglory.com/nzdusd-analysis-for-22-05-2017/


EURUSD analysis for 22.05.2017
EURUSD is almost free from the economic and political reports therefore this pair will be consolidating this week without being too much volatile.
The support rests at 1.11750 with resistance at 1.12030 which both lines are above the weekly pivot point at 1.11130. The EMA of 10 is moving with bullish bias along the ascendant channel and it is above the EMA of 100 and the EMA of 200. The RSI is moving horizontally in overbought area, the Stochastic is showing downward momentum and the MACD indicator is in positive territory. The ADX is showing buy signals.
The resistance level breakout will pave the way for further growth. Pullbacks will be observed on the way up.
https://fxglory.com/eurusd-analysis-for-22-05-2017/


Friday, May 19, 2017
GBPUSD analysis for 19.05.2017
GBP was supported due to the strong retail sales report.
The support rests at 1.29350 with resistance at 1.30290 which both lines are above the weekly pivot point at 1.29040. The EMA of 10 is moving with bullish bias along the ascendant channel and it is above the EMA of 200 and the EMA of 100. The RSI is rising above the 50 level, the Stochastic is moving in middle ranges and MACD indicator is in positive territory. The ADX is not showing any clear signals.
Long positions are recommended targeting 1.30.
https://fxglory.com/gbpusd-analysis-for-19-05-2017/


EURUSD analysis for 19.05.2017
Former FBI Director Comey’s claims regarding Trump and Russia plans supported USD after its decline.
The support rests at 1.10940 with resistance at 1.11300 which both lines are above the weekly pivot point at 1.09300. The EMA of 10 is moving horizontally along the ascendant channel and it is above the EMA of 100 and the EMA of 200. The RSI is moving in overbought area, the Stochastic is showing upward momentum and the MACD indicator is in positive territory. The ADX is not showing any clear signals.
Long positions are recommended targeting 1.1150.
https://fxglory.com/eurusd-analysis-for-19-05-2017/


AUDUSD analysis for 19.05.2017
There are no important economic reports in Australia or the US to influence AUDUSD.
The support rests in 0.73980 with resistance at 0.74420 which both lines are below the weekly pivot point at 0.73800. The EMA of 10 is moving with bullish bias along the descendant channel and it is located below the EMA of 200 and above the EMA of 100. The RSI is rising towards the overbought area, the MACD indicator is in positive territory and the Stochastic is showing upward momentum. The ADX is showing buy signals. The price is above the Ichimoku Cloud and above the Chinkou Span. The Tenkan-sen and the Kijun-sen are both showing a horizontal trend.
Long positions are recommended targeting 0.75.
https://fxglory.com/10793/


Thursday, May 18, 2017
USDJPY analysis for 18.05.2017
Japan is releasing GDP Growth Rate along with the US publishing Initial Jobless Claims.
The support rests at 110.640 with resistance at 111.440 which both lines are below the weekly pivot point at 113.360. The EMA of 10 is moving with bearish bias and it has passed the EMA of 100 and they are both above the EMA of 200. The RSI is rising towards the 50 level, the Stochastic is showing upward momentum and the MACD indicator is in negative territory. The ADX is showing sell signals.
USDJPY has started its correction pattern and it seems that it continues its bullish trend targeting 61.8 level of Fibonacci retracement at 112.9.
https://fxglory.com/usdjpy-analysis-for-18-05-2017/


USDCAD analysis for 18.05.2017
USDCAD is chiefly under the influence of the US and Russia negotiation.
The pair is finding support at 1.36020 with resistance at 1.36760 which both lines are below the weekly pivot point at 1.37070. The EMA of 10 is moving with bullish and it is located above the EMA of 200 and below the EMA of 100. The RSI is rising towards the 50 level, the MACD indicator is in negative territory and the Stochastic is showing upward momentum. The ADX is not showing any clear signals. The price is below the Ichimoku Cloud and the Chinkou Span. The Tenkan-sen and the Kijun-sen are both showing a downward trend.
Long positions are recommended targeting 1.37.
https://fxglory.com/usdcad-analysis-for-18-05-2017/


EURUSD analysis for 18.05.2017
EUR is acting stronger against USD since dollar has been under pressure due to the poor economic data and political developments.
The support rests at 1.11180 with resistance at 1.11840 which both lines are above the weekly pivot point at 1.09300. The EMA of 10 is moving with bullish bias along the ascendant channel and it is above the EMA of 100 and the EMA of 200. The RSI is moving in overbought area, the Stochastic is showing downward momentum and the MACD indicator is in positive territory. The ADX is showing buy signals.
EURUSD has started its pullback after reaching 1.11711, in terms of the price decline, sellers can target 1.1050 otherwise, the strong EUR will push the price up targeting 1.14.
https://fxglory.com/eurusd-analysis-for-18-05-2017/


Wednesday, May 17, 2017
NZDUSD analysis for 17.05.2017
New Zealand has already published PPI Input and Output reports.
The support rests at 0.68860 with resistance at 0.69160 which both lines are below the weekly pivot point at 0.68740. The EMA of 10 is moving with bullish bias along the ascendant channel but it is below the EMA of 100 and 200. The RSI is rising above the 50 level, the MACD indicator is in neutral territory and the Stochastic is showing upward momentum. The ADX is showing buy signals. The price is above the Ichimoku Cloud and the Chinkou Span. The Tenkan-sen is showing an upward trend while the Kijun-sen is showing a downward trend.
Long positions are recommended targeting 0.6950.
https://fxglory.com/nzdusd-analysis-for-17-05-2017/


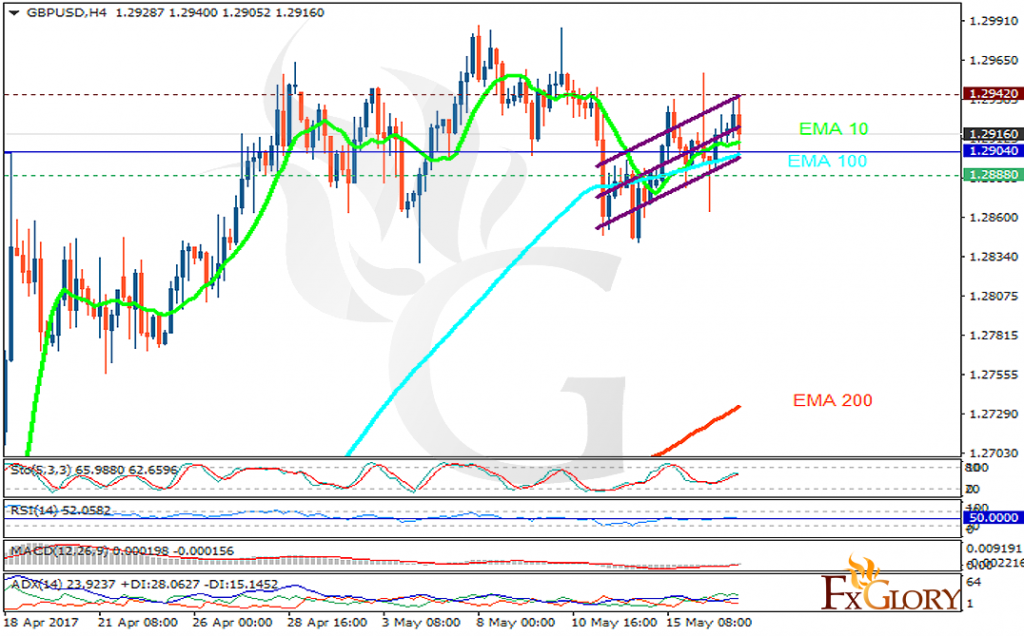
GBPUSD analysis for 17.05.2017
The Great Britain is publishing Unemployment Rate and Claimant Count Change which both will influence GBPUSD.
The support rests at 1.28880 with resistance at 1.29420 which the weekly pivot point at 1.29040 is located in between the lines. The EMA of 10 is moving with bullish bias along the ascendant channel and it is above the EMA of 200 and below the EMA of 100. The RSI is moving horizontally on the 50 level, the Stochastic is moving in middle ranges and MACD indicator is in negative territory. The ADX is showing buy signals.
GBPUSD has already created the bearish candle; short positions are recommended targeting 1.285.
https://fxglory.com/gbpusd-analysis-for-17-05-2017/

EURUSD analysis for 17.05.2017
USD is under pressure due to Trump’s negotiations with Russia.
The support rests at 1.10820 with resistance at 1.11280 which both lines are above the weekly pivot point at 1.09300. The EMA of 10 is moving with bullish bias along the ascendant channel and it is above the EMA of 100 and the EMA of 200. The RSI is moving in overbought area, the Stochastic is showing upward momentum and the MACD indicator is in positive territory. The ADX is showing buy signals.
Long term traders can target 1.12 while noting that pullbacks occur on the way.
https://fxglory.com/eurusd-analysis-for-17-05-2017/


Tuesday, May 16, 2017
USDJPY analysis for 16.05.2017
There are no important economic reports in Japan but the US is releasing Industrial Production YoY and Housing Starts MoM.
The support rests at 113.080 with resistance at 113.830 which the weekly pivot point at 113.360 is located in between the lines. The EMA of 10 is moving horizontally and it is above the EMA of 200 and the EMA of 100. The RSI is falling towards the oversold area, the Stochastic is showing downward momentum and the MACD indicator is in neutral territory. The ADX is showing sell signals.
Short positions are recommended targeting 112.50.
https://fxglory.com/usdjpy-analysis-for-16-05-2017/


Gold analysis for 16.05.2017
Gold has been moving with bullish bias after the previous low at 1214.14.
The support rests at 1231.72 with resistance at 1237.14 which both lines are above the weekly pivot point at 1226.30. The EMA of 10 is moving with bullish bias along the ascendant channel but it is below the EMA of 200 and the EMA of 100. The RSI is moving horizontally above the 50 level, the Stochastic is showing upward momentum and the MACD indicator is in neutral territory. The ADX is showing buy signals. The price is in the Ichimoku Cloud and above the Chinkou Span. The Tenkan-sen and the Kijun-sen are both showing a horizontal trend.
Long positions are recommended targeting 1240.
https://fxglory.com/gold-analysis-for-16-05-2017/


EURUSD analysis for 16.05.2017
Europe is releasing GDP Growth Rate and ZEW Economic Sentiment Index along with the US publishing Industrial Production MoM and Building Permits.
The support rests at 1.09750 with resistance at 1.10290 which both lines are above the weekly pivot point at 1.09300. The EMA of 10 is moving with bullish bias along the ascendant channel and it is above the EMA of 100 and the EMA of 200. The RSI is moving in overbought area, the Stochastic is showing upward momentum and the MACD indicator is in positive territory. The ADX is showing buy signals.
Long positions are recommended targeting 1.11.
https://fxglory.com/eurusd-analysis-for-16-05-2017/


Monday, May 15, 2017
USDCAD analysis for 15.05.2017
USDCAD is chiefly under the influence of the oil prices which have been growing since the last week.
The pair is finding support at 1.36110 with resistance at 1.37090 which both lines are above the monthly pivot point at 1.35210. The EMA of 10 is moving horizontally and it is located above the EMA of 100 and below the EMA of 200. The RSI is falling towards the oversold area, the MACD indicator is in neutral territory and the Stochastic is showing downward momentum. The ADX is showing sell signals. The price is below the Ichimoku Cloud and the Chinkou Span. The Tenkan-sen and the Kijun-sen are both showing a downward trend.
Short positions are recommended targeting 1.34 area.
https://fxglory.com/usdcad-analysis-for-15-05-2017/


GBPUSD analysis for 15.05.2017
Despite the positive economic reports in the Great Britain and the poor reports from the US, GBPUSD chart has not had any special movement.
The support rests at 1.28750 with resistance at 1.29430 which the weekly pivot point at 1.29040 is located in between the lines. The EMA of 10 is moving with bullish bias along the ascendant channel and it is above the EMA of 200 and below the EMA of 100. The RSI is rising towards the 50 level, the Stochastic is showing upward momentum and MACD indicator is in negative territory. The ADX is showing buy signals.
The resistance line seems to be too strong to be broken, therefore short positions are recommended for long tern trading targeting 1.2800.
https://fxglory.com/gbpusd-analysis-for-15-05-2017/


EURUSD analysis for 15.05.2017
ECB announcement regarding tapering its participation in the markets towards the ends of the year supported EUR and turn the EURUSD chart into a bullish trend.
The support rests at 1.09190 with resistance at 1.09420 which the weekly pivot point at 1.09300 is located in between the lines. The EMA of 10 is moving with bullish bias along the ascendant channel and it is above the EMA of 100 and the EMA of 200. The RSI is moving horizontally above the 50 level, the Stochastic is showing upward momentum and the MACD indicator is in neutral territory. The ADX is showing buy signals.
The pair will be fluctuating within the support and resistance area however, due to the strong resistance area, pullbacks can push the price towards 1.085.
https://fxglory.com/eurusd-analysis-for-15-05-2017/


Friday, May 12, 2017
USDJPY analysis for 12.05.2017
Today USDJPY will be chiefly under the influence of the US economic reports such as Inflation rate and the Retail Sales.
The support rests at 113.460 with resistance at 114.000 which both lines are above the weekly pivot point at 112.310. The EMA of 10 is moving with bullish bias along the ascendant channel and it is above the EMA of 200 and the EMA of 100. The RSI is moving horizontally on the 50 level, the Stochastic is moving in middle ranges and the MACD indicator is in neutral territory. The ADX is showing sell signals.
Long term traders can target 115 while considering the pullbacks on the way.
https://fxglory.com/usdjpy-analysis-for-12-05-2017/


NZDUSD analysis for 12.05.2017
NZD is under pressure due to the global demand of commodities.
The support rests at 0.68210 with resistance at 0.68530 which both lines are below the weekly pivot point at 0.69080. The EMA of 10 is moving with bearish bias along the descendant channel and it is below the EMA of 100 and 200. The RSI is moving horizontally below the 50 level, the MACD indicator is in negative territory and the Stochastic is moving in low ranges. The ADX is not showing any clear signals. The price is below the Ichimoku Cloud and the Chinkou Span. The Tenkan-sen is showing a downward trend while the Kijun-sen is showing a horizontal trend.
Short positions are recommended targeting 0.68.
https://fxglory.com/nzdusd-analysis-for-12-05-2017/


EURUSD analysis for 12.05.2017
USD has been stable for some time with a slight growth. Still there is no news regarding the Fed rate hike.
The support rests at 1.08570 with resistance at 1.08780 which both lines are below the weekly pivot point at 1.09570. The EMA of 10 is moving with bearish bias along the descendant channel and it has passed the EMA of 100 and they are both above the EMA of 200. The RSI is moving horizontally below the 50 level, the Stochastic is showing upward momentum and the MACD indicator is in negative territory. The ADX is not showing any clear signals.
The fluctuation will continue within the support and resistance area with a slight decline.
https://fxglory.com/eurusd-analysis-for-12-05-2017/


Thursday, May 11, 2017
GBPUSD analysis for 11.05.2017
GBPUSD has been growing slowly since the previous high at 1.29033 creating an ascendant rectangle.
The support rests at 1.28859 with resistance at 1.29540 which the weekly pivot point at 1.29290 is located in between the lines. The EMA of 10 is moving with bullish bias along the ascendant channel and it is above the EMA of 200 and the EMA of 100. The RSI is moving horizontally on the 50 level, the Stochastic is showing upward momentum and MACD indicator is in neutral territory. The ADX is not showing any clear signals.
Long positions are recommended targeting 1.3030.
https://fxglory.com/gbpusd-analysis-for-11-05-2017/


EURUSD analysis for 11.05.2017
EURUSD continued its bearish trend since yesterday and today there are no important economic reports only the US will publish Unemployment Claims.
The support rests at 1.08560 with resistance at 1.08860 which both lines are below the weekly pivot point at 1.09570. The EMA of 10 is moving with bearish bias along the descendant channel but it is above the EMA of 100 and the EMA of 200. The RSI is rising towards the 50 level, the Stochastic is showing upward momentum and the MACD indicator is in negative territory. The ADX is not showing any clear signals.
Short positions are recommended targeting 1.080.
https://fxglory.com/eurusd-analysis-for-11-05-2017/


AUDUSD analysis for 11.05.2017
AUD is under pressure due to the Gold market.
The support rests in 0.73360 with resistance at 0.73740 which both lines are below the weekly pivot point at 0.74450. The EMA of 10 is moving with bearish bias along the descendant channel and it is located below the EMA of 100 and the EMA of 200. The RSI is rising towards the 50 level, the MACD indicator is in negative territory and the Stochastic is moving in low ranges. The ADX is not showing any clear signals. The price is below the Ichimoku Cloud and above the Chinkou Span. The Tenkan-sen and the Kijun-sen are both showing a horizontal trend.
Long positions are recommended targeting 0.75 area.
https://fxglory.com/audusd-analysis-for-11-05-2017/


Wednesday, May 10, 2017
USDJPY analysis for 10.05.2017
Japan is publishing Leading Economic Index along with the US releasing Import and Export Prices.
The support rests at 113.490 with resistance at 114.090 which both lines are above the weekly pivot point at 112.310. The EMA of 10 is moving with bullish bias along the ascendant channel and it is above the EMA of 200 and the EMA of 100. The RSI is moving horizontally in the overbought area, the Stochastic is showing downward momentum and the MACD indicator is in positive territory. The ADX is showing buy signals.
Long positions are recommended targeting 114.50.
https://fxglory.com/usdjpy-analysis-for-10-05-2017/


USDCAD analysis for 10.05.2017
USDCAD has not been volatile and the oil market has been quiet as well.
The pair is finding support at 1.36970 with resistance at 1.37390 which both lines are above the monthly pivot point at 1.35210. The EMA of 10 is moving horizontally and it is located above the EMA of 100 and below the EMA of 200. The RSI is moving in the 50 level, the MACD indicator is in negative territory and the Stochastic is showing downward momentum. The ADX is not showing any clear signals. The price is above the Ichimoku Cloud and the Chinkou Span. The Tenkan-sen and the Kijun-sen are both showing a horizontal trend.
Short positions are recommended targeting 1.3610.
https://fxglory.com/usdcad-analysis-for-10-05-2017/


EURUSD analysis for 10.05.2017
There are no major economic reports in the US or Eurozone however there is ECB President Draghi’s speech which may influence EURUSD.
The support rests at 1.08820 with resistance at 1.09000 which both lines are below the weekly pivot point at 1.09570. The EMA of 10 is moving with bearish bias along the descendant channel but it is above the EMA of 100 and the EMA of 200. The RSI is moving below the 50 level, the Stochastic is showing upward momentum and the MACD indicator is in negative territory. The ADX is showing sell signals.
Short positions are recommended targetin 1.085.
https://fxglory.com/eurusd-analysis-for-10-05-2017/


Tuesday, May 9, 2017
NZDUSD analysis for 09.05.2017
New Zealand is publishing Card Spending (MoM) along with the US releasing Wholesale Inventories.
The support rests at 0.68680 with resistance at 0.69180 which the weekly pivot point at 0.69080 is located in between the lines. The EMA of 10 is moving with bearish bias along the descendant channel and it is below the EMA of 100 and 200. The RSI is falling towards the oversold area, the MACD indicator is in neutral territory and the Stochastic is showing downward momentum. The ADX is not showing any clear signals. The price is below the Ichimoku Cloud and the Chinkou Span. The Tenkan-sen and the Kijun-sen are both showing a downward trend.
Short positions are recommended targeting 0.6850.
https://fxglory.com/nzdusd-analysis-for-09-05-2017/


GBPUSD analysis for 09.05.2017
There are no important economic reports in the Great Britain or the USA to influence GBPUSD.
The support rests at 1.29300 with resistance at 1.29660 which both lines are above the monthly pivot point at 1.27570. The EMA of 10 is moving with bullish bias along the ascendant channel and it is above the EMA of 200 and the EMA of 100. The RSI is moving horizontally on the 50 level, the Stochastic is showing upward momentum and MACD indicator is in neutral territory. The ADX is not showing any clear signals.
GBPUSD does not seem to be volatile today however, the resistance level breakout is a good signal for buying opportunity targeting 1.30 otherwise the pair will fall towards 1.28.
https://fxglory.com/gbpusd-analysis-for-09-05-2017/


Subscribe to:
Posts (Atom)