Monday, January 30, 2017

NZDUSD analysis for 30.01.2017

There have been no important economic reports to influence NZDUSD.
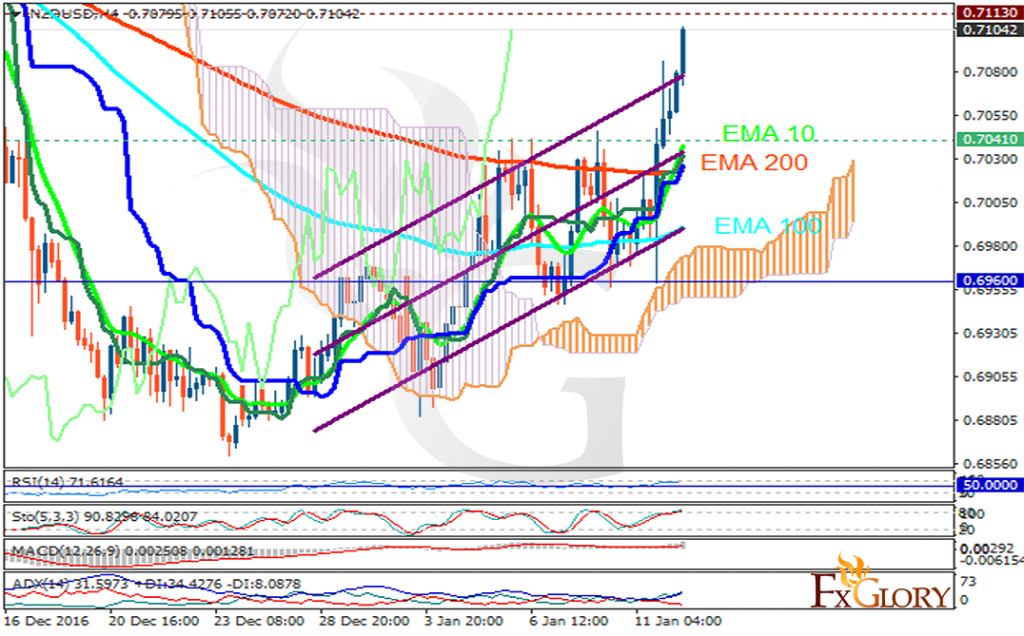
The support rests in 0.72300 with resistance at 0.72900 which both lines are above the monthly pivot point at 0.70050. The EMA of 10 is moving with bullish bias and it is located above the EMA of 100 and the EMA of 200. The RSI is falling towards the 50 level, the MACD indicator is in positive territory and the Stochastic is showing downward momentum. The ADX is not showing any clear signals. The price is in the Ichimoku Cloud and below the Chinkou Span. The Tenkan-sen and the Kijun-sen are both showing a horizontal trend.
Long positions are recommended targeting 0.731 area.

https://fxglory.com/nzdusd-analysis-for-30-01-2017/


USDJPY analysis for 30.01.2017

The growing USD is putting pressure on JPY.
The support rests at 114.150 with resistance at 114.790 which the weekly pivot point at 114.620 is located in between the lines. The EMA of 10 is moving horizontally and it is above the EMA of 200 and the EMA of 100. The RSI is rising above the 50 level, the Stochastic is showing downward momentum and the MACD indicator is in positive territory. The ADX is showing a buy signal.
The pair will continue its bullish trend targeting 116 area.

https://fxglory.com/usdjpy-analysis-for-30-01-2017/


EURUSD analysis for 30.01.2017

There have been no important economic reports to influence EURUSD.
The support rests at 1.07130 with resistance at 1.07430 which both lines are above the weekly pivot point at 1.07000. The EMA of 10 is moving with bullish bias along the ascendant channel and it is above the EMA of 100 and the EMA of 200. The RSI is falling close to 50 level, the Stochastic is showing upward momentum and the MACD indicator is in negative territory. The ADX is showing a weak sell signal.
Despite the pair’s bearish tone, it will rise towards 1.0750 area.

https://fxglory.com/eurusd-analysis-for-30-01-2017/


Thursday, January 26, 2017

USDCAD analysis for 26.01.2017

CAD is under pressure due to Trump’s plans regarding Keystone XL and oil pipelines.
The pair is finding support at 1.30520 with resistance at 1.30940 which both lines are above the weekly pivot point at 1.32380. The EMA of 10 is moving with bearish bias and it is located below the EMA of 100 and EMA of 200. The RSI is rising towards the 50 level, the MACD indicator is in negative territory and the Stochastic is moving in low ranges. The ADX is not showing any clear signals.
The pair is creating the correction pattern after its decline towards 1.3051 area therefore it will rise towards 1.32 level.


https://fxglory.com/usdcad-analysis-for-26-01-2017/


GBPUSD analysis for 26.01.2017

The UK Industrial Trends Survey supported GBP.
The support rests at 1.26170 with resistance at 1.26810 which both lines are above the weekly pivot point at 1.22570. The EMA of 10 is moving with bullish bias along the ascendant channel and it is above the EMA of 200 and the EMA of 100. The RSI is moving overbought area, the Stochastic is moving in high ranges and the MACD indicator is in positive territory. The ADX is showing buy signals.
The resistance level breakout will smooth the way for further growth targeting 1.270 otherwise it will decline towards 1.260.

https://fxglory.com/gbpusd-analysis-for-26-01-2017/


EURUSD analysis for 26.01.2017

EUR is losing momentum due to the negative Business Climate in Germany.
The support rests at 1.07350 with resistance at 1.07710 which both lines are above the weekly pivot point at 1.06660. The EMA of 10 is moving with bullish bias along the ascendant channel and it is above the EMA of 100 and the EMA of 200. The RSI is falling close to 50 level, the Stochastic is showing upward momentum and the MACD indicator is in positive territory. The ADX is not showing any clear signals.
Bears are taking the control of the chart therefore short positions are recommended targeting 1.070 area.

https://fxglory.com/eurusd-analysis-for-26-01-2017/


Wednesday, January 25, 2017

NZDUSD analysis for 25.01.2017

NZD is acting stronger against its American counterpart and it is climbing the ascendant channel.
The support rests in 0.72190 with resistance at 0.72610 which both lines are above the weekly pivot point at 0.71550. The EMA of 10 is moving with bullish bias and it is located above the EMA of 100 and the EMA of 200. The RSI is moving above the 50 level, the MACD indicator is in positive territory and the Stochastic is showing downward momentum. The ADX is not showing any clear signals.
The resistance level break out will smooth the way for further growth targeting 0.73 area otherwise, the pair will fall towards 0.7100.

https://fxglory.com/nzdusd-analysis-for-25-01-2017/


USDJPY analysis for 25.01.2017

While Trump’s speech left a negative impact on USD, JPY is being supported by the Manufacturing PMI.
The support rests at 113.250 with resistance at 113.850 which both lines are below the weekly pivot point at 114.240. The EMA of 10 is moving horizontally and it is below the EMA of 200 and the EMA of 100. The RSI is falling below the 50 level, the Stochastic is showing downward momentum and the MACD indicator is in negative territory. The ADX is not showing any clear signals. The price is below the Ichimoku Cloud and below the Chinkou Span. The Tenkan-sen and the Kijun-sen are both showing a horizontal trend.
Short positions are recommended targeting 112 area.

https://fxglory.com/usdjpy-analysis-for-25-01-2017/


EURUSD analysis for 25.01.2017

EUR is being supported by the Manufacturing PMI in Germany but it is losing power due to Services PMI.
The support rests at 1.07060 with resistance at 1.07480 which both lines are above the weekly pivot point at 1.06660. The EMA of 10 is moving with bearish bias but it is above the EMA of 100 and the EMA of 200. The RSI is moving close to 50 level, the Stochastic is showing downward momentum and the MACD indicator is in positive territory. The ADX is showing a sell signal. The price is falling down within Andrew’s pitchfork.
Bears are controlling the chart therefore sellers can target 61.8 level of Fibonacci retracement at 1.066 area.


https://fxglory.com/eurusd-analysis-for-25-01-2017/

Monday, January 23, 2017

GBPUSD analysis for 24.01.2017

GBP is acting stronger against USD which has been weakened due to the new president’s speech.
The support rests at 1.24920 with resistance at 1.25540 which both lines are above the weekly pivot point at 1.22570. The EMA of 10 is moving with bullish bias along the ascendant channel and it is above the EMA of 200 and the EMA of 100. The RSI is moving overbought area, the Stochastic is moving in high ranges and the MACD indicator is in positive territory. The ADX is showing buy signals.
Bears are taking the control of the chart therefore sellers can target the previous high at 1.24 area.

https://fxglory.com/gbpusd-analysis-for-24-01-2017/


AUDUSD analysis for 24.01.2017

AUD is getting popular due to the high Copper demand however, USD is still weakening because of Trump’s speech.
The support rests in 0.75640 with resistance at 0.76160 which both lines are above the weekly pivot point at 0.75330. The EMA of 10 is moving with bullish bias along the ascendant channel and it is located above the EMA of 100 and the EMA of 200. The RSI is falling towards the 50 level, the MACD indicator is in the positive territory and the Stochastic is moving in high ranges. The ADX is showing a buy signal. The price is above the Ichimoku Cloud and below the Chinkou Span. The Tenkan-sen and the Kijun-sen are both showing an upward trend.
Considering the bullish indicators, long positions are recommended targeting 0.7600 area.

https://fxglory.com/audusd-analysis-for-24-01-2017/


EURUSD analysis for 24.01.2017

EURUSD is chiefly under the influence of some economic reports in Europe such as PMI – Composite (M/M), PMI – Manufacturing (M/M) and PMI – Services (M/M) and the US is releasing Markit Manuf PMI    , Existing Home Sales and Richmond Manuf Index (M/M).
The support rests at 1.07410 with resistance at 1.07690 which both lines are above the weekly pivot point at 1.06660. The EMA of 10 is moving with bullish bias and it is above the EMA of 100 and the EMA of 200. The RSI is moving in overbought area, the Stochastic is moving in its maximum rate and the MACD indicator is in positive territory. The ADX is showing a buy signal.
While 1.0769 is a very strong resistance zone for EURUSD, bears will come back trying to keep the price neutral however since all the indicators are showing upward momentum, it’s better for traders to wait for a better chart setup.

https://fxglory.com/eurusd-analysis-for-24-01-2017/


EURUSD analysis for 23.01.2017

USD was weakened by the Yellen’s comments and EUR did not grew even though Germany PPI was align with expectations. The support rests at 1.07290 with resistance at 1.07590 which both lines are above the weekly pivot point at 1.06660. The EMA of 10 is moving with bullish bias and it is above the EMA of 100 and the EMA of 200. The RSI is moving in overbought area, the Stochastic is moving in its maximum rate and the MACD indicator is in positive territory. The ADX is showing a buy signal. 1.072 level seems to be such a strong resistance zone to be broken today therefore pullbacks are happening targeting 1.0600 area.


https://fxglory.com/eurusd-analysis-for-23-01-2017/


USDJPY analysis for 23.01.2017

While USD declined due to Yellen’s speech, Trump’s comments supported this currency and helped it grow. The support rests at 113.050 with resistance at 113.890 which both lines are below the weekly pivot point at 114.240. The EMA of 10 is moving with bearish bias along the descendant channel but it is below the EMA of 200 and the EMA of 100. The RSI is rising towards the 50 level, the Stochastic is moving in low ranges and the MACD indicator is in neutral territory. The ADX is showing a sell signal. The price has passed the 61.8 level of Fibonacci retracement therefore it may start its growth soon. Long positions are recommended targeting 116 area.


https://fxglory.com/usdjpy-analysis-for-23-01-2017/


USDCAD analysis for 23.01.2017

CAD was weakened due to Canadian economic reports such as Retail Sales and Consumer Price index. The pair is finding support at 1.32680 with resistance at 1.33060 which both lines are above the weekly pivot point at 1.32380. The EMA of 10 is moving with bearish bias and it is located above the EMA of 100 and EMA of 200. The RSI is moving on the 50 level, the MACD indicator is in positive territory and the Stochastic is moving in low ranges. The ADX is not showing any clear signals. The price is above the Ichimoku Cloud and below the Chinkou Span. The Tenkan-sen is showing a downward trend while the Kijun-sen is showing a horizontal trend. Bulls are getting the control of the chart therefore long positions are recommended targeting 1.34 area.

https://fxglory.com/usdcad-analysis-for-23-01-2017/


Friday, January 20, 2017

NZDUSD analysis for 20.01.2017

NZD is getting strength by New Zealand Business PMI and oil prices and at the same time it is under pressure due to the positive US economic data and New Zealand Building Permits. The support rests in 0.71400 with resistance at 0.72360 which both lines are above the weekly pivot point at 0.70720. The EMA of 10 is moving with bullish bias and it is located above the EMA of 100 and the EMA of 200. The RSI is moving on 50 level, the MACD indicator is in positive territory and the Stochastic is showing downward momentum. The ADX is not showing any clear signals. The price is declining targeting 0.7100.


https://fxglory.com/nzdusd-analysis-for-20-01-2017/


GBPUSD analysis for 20.01.2017

While GBP is getting weakened due to the Housing Price Balance, USD is being supported by Initial Jobless Claims and Housing data. The support rests at 1.23130 with resistance at 1.23950 which both lines are above the weekly pivot point at 1.21820. The EMA of 10 is moving with bullish bias along the ascendant channel and it is getting close to the EMA of 200 but they are both above the EMA of 100. The RSI is falling towards the 50 level, the Stochastic is moving in high ranges, showing downward momentum and the MACD indicator is in positive territory. The ADX is showing buy signals. The price is falling down reaching 1.2300 area.


https://fxglory.com/gbpusd-analysis-for-20-01-2017/


EURUSD analysis for 20.01.2017

USD is empowered due to the Initial Jobless Claims and Housing data. The support rests at 1.06380 with resistance at 1.07080 which both lines are above the weekly pivot point at 1.05920. The EMA of 10 is moving with bullish bias but it is above the EMA of 100 and the EMA of 200. The RSI is getting close to the 50 level, the Stochastic is moving in its maximum rate while showing downward momentum and the MACD indicator is in positive territory. The ADX is not showing any clear signals. The price is above the Ichimoku Cloud and below the Chinkou Span. The Tenkan-sen and the Kijun-sen are both showing a horizontal trend. It seems that bears are getting stronger therefore sellers can target 1.0600.

https://fxglory.com/eurusd-analysis-for-20-01-2017/


Thursday, January 19, 2017

AUDUSD analysis for 19.01.2017

AUD is being empowered by the oil prices and labor market data against its American counterpart. The support rests in 0.74940 with resistance at 0.75400 which both lines are above the weekly pivot point at 0.74340. The EMA of 10 is moving with bullish bias along the ascendant channel and it is located above the EMA of 100 and the EMA of 200. The RSI is rising towards the overbought area, the MACD indicator is in the positive territory, heading down, and the Stochastic is showing upward momentum, showing downward momentum. The ADX is showing a weak buy signal. The price is above the Ichimoku Cloud and the Chinkou Span. The Tenkan-sen and the Kijun-sen are both showing a horizontal trend. The pair will rise towards the 0.7550 level but then will start its bearish trend.

https://fxglory.com/audusd-analysis-for-19-01-2017/


USDJPY analysis for 19.01.2017

There have been no important economic reports in Japan or the US therefore USDJPY is under the influence of Yellen’s speech. The support rests at 114.230 with resistance at 114.970 which both lines are below the weekly pivot point at 115.240. The EMA of 10 is moving with bullish bias along the ascendant channel but it is below the EMA of 200 and the EMA of 100. The RSI is rising towards the overbought area, the Stochastic is moving in high ranges and the MACD indicator is in negative territory. The ADX is showing a buy signal. The chart seems to be bullish to cover the previous decline. The bullish trend will continue until it reaches the 61.8 level of Fibonacci retracement.

https://fxglory.com/usdjpy-analysis-for-19-01-2017/


EURUSD analysis for 19.01.2017

USD is being supported due to the US consumer price index and Yellen’s comments. The support rests at 1.06180 with resistance at 1.06560 which both lines are above the weekly pivot point at 1.05920. The EMA of 10 is moving with bearish bias but it is above the EMA of 100 and the EMA of 200. The RSI is moving on the 50 level, the Stochastic is moving in its minimum rate and the MACD indicator is in positive territory. The ADX is not showing any clear signals. The pair will be fluctuating within Andrew’s pitchfork. At the moment it will rise towards the resistance area.

https://fxglory.com/eurusd-analysis-for-19-01-2017/


Wednesday, January 18, 2017

Gold analysis for 18.01.2017

Gold was empowered due to the Theresa May’s speech. The support rests at 1206.90 with resistance at 1220.80 which both lines are above the weekly pivot point at 1191.69. The EMA of 10 is moving with bullish bias along the ascendant channel and it is above the EMA of 200 and the EMA of 100. The RSI is moving horizontally in overbought area, the Stochastic is showing downward momentum and the MACD indicator is in positive territory. The ADX is not showing any clear signals. The price is above the Ichimoku Cloud and below the Chinkou Span. The Tenkan-sen and the Kijun-sen are both showing a horizontal trend. Long positions are recommended targeting 1220 area then sellers can open their positions for the coming pullbacks.


https://fxglory.com/gold-analysis-for-18-01-2017/


GBPUSD analysis for 18.01.2017

GBPUSD is chiefly under the influence of Unemployment Rate and Average Earnings. The support rests at 1.23080 with resistance at 1.23720 which both lines are above the weekly pivot point at 1.21820. The EMA of 10 is moving with bullish bias along the ascendant channel and it is below the EMA of 200 and above the EMA of 100. The RSI is falling towards the 50 level, the Stochastic is showing downward momentum and the MACD indicator is in positive territory. The ADX is not showing any clear signals. The price is above the Ichimoku Cloud and below the Chinkou Span. The Tenkan-sen and the Kijun-sen are both showing a horizontal trend. The price is declining towards 1.2300 area.


https://fxglory.com/gbpusd-analysis-for-18-01-2017/


EURUSD analysis for 18.01.2017

As EUR was weakened due to the Economic Sentiment in Germany, it will be under the influence of Consumer Price Index in Germany. The support rests at 1.06680 with resistance at 1.07080 which both lines are above the weekly pivot point at 1.05920. The EMA of 10 is moving with bullish bias and it is above the EMA of 100 and the EMA of 200. The RSI is falling towards the 50 level, the Stochastic is showing downward momentum and the MACD indicator is in positive territory. The ADX is not showing any clear signals. The pair will be falling down within Andrew’s pitchfork. Sellers can target 1.0650 followed by 1.0600.

https://fxglory.com/eurusd-analysis-for-18-01-2017/


Tuesday, January 17, 2017

NZDUSD analysis for 17.01.2017

Today NZDUSD is only under the influence of the US Empire Manufacturing. The support rests in 0.71140 with resistance at 0.71770 which both lines are above the weekly pivot point at 0.70720. The EMA of 10 is moving with bullish bias and it is located above the EMA of 100 and the EMA of 200. The RSI is moving in overbought area, the MACD indicator is in positive territory and the Stochastic is showing upward momentum. The ADX is showing a buy signal. The price is above the Ichimoku Cloud and the Chinkou Span. The Tenkan-sen and the Kijun-sen are both showing upward trend. There might be some short term growth however the pullbacks will start soon targeting 0.705 area.


https://fxglory.com/nzdusd-analysis-for-17-01-2017/


USDJPY analysis for 17.01.2017

USDJPY is declining along the descendant channel creating lower highs and lower lows. The support rests at 113.100 with resistance at 113.930 which both lines are below the weekly pivot point at 115.240. The EMA of 10 is moving with bearish bias along the descendant channel and it is below the EMA of 200 and the EMA of 100. The RSI is moving in oversold area, the Stochastic is showing downward momentum and the MACD indicator is in negative territory. The ADX is showing a sell signal. The support area seems to be strong for this pair therefore it would be not easy to be broken therefore buyers can expect a price correction and wait for 115 area.


https://fxglory.com/usdjpy-analysis-for-17-01-2017/


EURUSD analysis for 17.01.2017

While EU’s trade Balance supported EUR, traders are waiting for Economic Sentiment for January from ZEW. The support rests at 1.06200 with resistance at 1.06760 which both lines are above the weekly pivot point at 1.05920. The EMA of 10 is moving with bullish bias and it is above the EMA of 100 and the EMA of 200. The RSI is falling towards the 50 level, the Stochastic is showing upward momentum and the MACD indicator is in positive territory, heading down. The ADX is showing a buy signal. The next candle seems to be bearish after the bullish candle. Sellers target can be 1.0550.


https://fxglory.com/eurusd-analysis-for-17-01-2017/


Monday, January 16, 2017

AUDUSD analysis for 16.01.2017

While Producer Price Index supported USD, negative Retail Sales report weakened this currency against its Australian counterpart. The support rests in 0.74310 with resistance at 0.75090 which both lines are above the monthly pivot point at 0.72950. The EMA of 10 is moving with bearish bias and it is located above the EMA of 100 and the EMA of 200. The RSI is falling towards the 50 level, the MACD indicator is in the positive territory and the Stochastic is showing downward momentum. The ADX is not showing any clear signals. The pair will probably fall down towards the 38.2 level of Fibonacci retracement around 0.74 area.


https://fxglory.com/audusd-analysis-for-16-01-2017/


GBPUSD analysis for 16.01.2017

Producer Price Index supported the USD. The support rests at 1.19880 with resistance at 1.20690 which both lines are below the weekly pivot point at 1.21820. The EMA of 10 is moving with bearish bias along the descendant channel and it is below the EMA of 100 and the EMA of 200. The RSI is moving in oversold area, the Stochastic is moving in low ranges showing downward momentum and the MACD indicator is in negative territory. The ADX is showing a weak sell signal. The price is below the Ichimoku Cloud and above the Chinkou Span. The Tenkan-sen and the Kijun-sen are both showing a horizontal trend. Sellers can target 1.200 area at this moment.


https://fxglory.com/gbpusd-analysis-for-16-01-2017/


EURUSD analysis for 16.01.2017

While Producer Price Index supported USD, Retail Sales report weakened this currency. On the other hand, Wholesale Price Index in Germany and Consumer Price Index in Spain could not help EUR to grow. The support rests at 1.05840 with resistance at 1.06530 which the weekly pivot point at 1.05920 is located in between the lines. The EMA of 10 is moving with bearish bias and it is above the EMA of 100 and the EMA of 200. The RSI is falling on the 50 level, the Stochastic is showing downward momentum and the MACD indicator is in positive territory. The ADX is showing a weak sell signal. Short positions are recommended targeting 1.0500.


https://fxglory.com/eurusd-analysis-for-16-01-2017/


Trading Hours of Martin Luther King Day

Dear Clients,

With regards to the Martin Luther King Day celebration in the USA on January 16th 2017, trading hours on Spot Metals and Oil will be changed. 

These assets will be unavailable from 20:00 (GMT +2) 16.01.2017 till 01:15 (GMT +2) 17.01.2017. 

Best Regards,
Fxglroy Management Team

Friday, January 13, 2017

USDCAD analysis for 13.01.2017

While USD is being supported by Trump’s speech, CAD is gaining momentum due to the oil prices. The pair is finding support at 1.31250 with resistance at 1.31810 which both lines are below the weekly pivot point at 1.32910. The EMA of 10 is moving with bearish bias along the descendant channel and it is located below the EMA of 100 and EMA of 200. The RSI is rising towards the 50 level, the MACD indicator is in negative territory and the Stochastic is moving in high ranges. The ADX is not showing any clear signals. The price is below the Ichimoku Cloud and above the Chinkou Span. The Tenkan-sen is showing a downward trend while the Kijun-sen is showing a horizontal trend. The support level breakthrough will make the pair fall towards 1.3050.

https://fxglory.com/usdcad-analysis-for-13-01-2017/


USDJPY analysis for 13.01.2017

JPY is being supported due to the new president’s speech and Japan’s satisfactory economic reports. The support rests at 114.42 with resistance at 115.530 which both lines are below the weekly pivot point at 116.870. The EMA of 10 is moving with bearish bias along the descendant channel and it has reached the EMA of 200 but both are below the EMA of 100. The RSI is falling below the 50 level, the Stochastic is moving in high ranges and the MACD indicator is in negative territory. The ADX is showing a sell signal. The support level breakthrough will smooth the way for further decline targeting 113.


https://fxglory.com/usdjpy-analysis-for-13-01-2017/


EURUSD analysis for 13.01.2017

EUR has been empowered by the positive economic reports in euro zone such as Consumer Price index and EU’s Industrial Production. The support rests at 1. 05130 with resistance at 1.06820 which both lines are above the weekly pivot point at 1.04960. The EMA of 10 is moving with bullish bias along the ascendant channel and it is above the EMA of 100 and the EMA of 200. The RSI is moving above the 50 level, the Stochastic is moving in low ranges and the MACD indicator is in positive territory. The ADX is showing a weak buy signal. The chart seems bullish at the moment; the pair may grow to 1.071 area.

https://fxglory.com/eurusd-analysis-for-13-01-2017/


NZDUSD analysis for 12.01.2017

The oil price is leaving a negative impact on NZD. The support rests in 0.70410 with resistance at 0.71130 which both lines are above the weekly pivot point at 0.69600. The EMA of 10 is moving with bullish bias and it is located above the EMA of 100 and the EMA of 200. The RSI is moving in overbought area, the MACD indicator is in positive territory and the Stochastic is moving horizontally in its maximum ranges. The ADX is showing a buy signal. The price is above the Ichimoku Cloud and the Chinkou Span. The Tenkan-sen and the Kijun-sen are both showing upward trend. The resistance level breakout will make it difficult for the pair to grow higher, therefore short positions are recommended targeting 0.6950.

https://fxglory.com/nzdusd-analysis-for-12-01-2017/


GBPUSD analysis for 12.01.2017

While GBP is being supported by Industrial and Manufacturing Production, it is losing power due to some other economic reports such as Trade Balance and Goods Trade Balance. The support rests at 1.21330 with resistance at 1.22830 which both lines are below the weekly pivot point at 1.23030. The EMA of 10 is moving with bullish bias but it is below the EMA of 100 and the EMA of 200. The RSI is moving on the 50 level, the Stochastic is moving in high ranges, showing downward momentum and the MACD indicator is in negative territory. The ADX is showing a weak buy signal. The price has reached the 61.8 level of Fibonacci retracement therefore pullbacks are happening soon. Sellers can target 1.2100 for the first pullback.

https://fxglory.com/gbpusd-analysis-for-12-01-2017/


EURUSD analysis for 12.01.2017

There have been no important economic reports therefore EURUSD is massively under the influence of Trump’s speech. The support rests at 1. 05600 with resistance at 1.06530 which both lines are above the weekly pivot point at 1.04960. The EMA of 10 is moving with bullish bias along the ascendant channel and it has reached the EMA of 200; they are both above the EMA of 100. The RSI is moving in overbought area, the Stochastic is moving in high ranges and the MACD indicator is in positive territory. The ADX is showing a buy signal. The resistance level is not going to be broken therefore sellers can make profit by pullbacks targeting 1.050 area.

https://fxglory.com/eurusd-analysis-for-12-01-2017/


Wednesday, January 11, 2017

AUDUSD analysis for 11.01.2017

AUD is losing power against its American counterpart due to Retail Sales release and Chinese CPI. The support rests in 0.73530 with resistance at 0.73950 which both lines are above the weekly pivot point at 0.72800. The EMA of 10 is moving with bullish bias along the ascendant channel and it is located above the EMA of 100 and the EMA of 200. The RSI is moving on overbought area, the MACD indicator is in the positive territory and the Stochastic is in high ranges, showing downward momentum. The ADX is showing a buy signal. The price has reached the 61.8 level of Fibonacci retracement therefore it is time for pullbacks after several days of growth. Sellers can target 0.7300 for the pair potential decline.


https://fxglory.com/audusd-analysis-for-11-01-2017/


GBPUSD analysis for 11.01.2017

May’s recent comments did not leave any impact on GBP and now GBPUSD is chiefly under the influence of Manufacturing Production and Industrial Production releases. The support rests at 1.21450 with resistance at 1.21750 which both lines are below the weekly pivot point at 1.23030. The EMA of 10 is falling down along the descendant channel and it is below the EMA of 100 and the EMA of 200. The RSI is moving below the 50 level, the Stochastic is moving in high ranges, showing downward momentum and the MACD indicator is in negative territory. The ADX is showing a weak sell signal. The price is below the Ichimoku Cloud and the Chinkou Span. The Tenkan-sen and the Kijun-sen are both showing horizontal trend. Short positions are recommended targeting 1.2100.

https://fxglory.com/gbpusd-analysis-for-11-01-2017/


EURUSD analysis for 11.01.2017

EUR was empowered by the EU’s Investor Confidence and at the same time Fed’s comments left a positive impact on USD. EURUSD will be affected by today Trump’s conference. The support rests at 1.05370 with resistance at 1.05610 which both lines are above the weekly pivot point at 1.04960. The EMA of 10 is moving with bearish bias and it is above EMA of 100 and below the EMA of 200. The RSI is moving above the 50 level area, the Stochastic is moving in low ranges and the MACD indicator is in positive territory. The ADX is showing a sell signal. It seems that the pair is going to fall within the Andrew’s pitchfork. Short positions are recommended targeting 1.050 area.


https://fxglory.com/eurusd-analysis-for-11-01-2017/


Tuesday, January 10, 2017

USDCAD analysis for 10.01.2017

USDCAD is under the influence of oil prices. The pair is finding support at 1.31770 with resistance at 1.32530 which both lines are below the weekly pivot point at 1.32910. The EMA of 10 is moving with bearish bias along the descendant channel and it is located below the EMA of 100 and EMA of 200. The RSI is rising towards the 50 level, the MACD indicator is in negative territory and the Stochastic is moving in low ranges, showing upward momentum. The ADX is showing a weak sell signal. The price is fluctuating between the 61.8 and 78.6 levels of Fibonacci therefore it may start is upward trend soon. The resistance level breakout will smooth the way for further growth targeting 1.3330 however the support level breakthrough will lead the pair down towards 1.3120.


https://fxglory.com/usdcad-analysis-for-10-01-2017/


USDJPY analysis for 10.01.2017

Since Japanese markets were closed, today USDJPY is chiefly under the influence of Fed’s representatives’ comments. The support rests at 115.110 with resistance at 116.120 which both lines are below the weekly pivot point at 116.870. The EMA of 10 is moving with bearish bias along the descendant channel and it is located below the EMA of 100 and above the EMA of 200. The RSI is rising towards the 50 level, the Stochastic is showing upward momentum and the MACD indicator is in negative territory. The ADX is showing a sell signal. The price is below the Ichimoku Cloud and above the Chinkou Span. The Tenkan-sen and the Kijun-sen are both showing horizontal trend. USDJPY will continue its upward trend until it reaches 118.00, then sellers can make profit from the pullbacks.


https://fxglory.com/usdjpy-analysis-for-10-01-2017/


EURUSD analysis for 10.01.2017

While Industrial Production in Germany left a negative impact on EUR, Trade Balance supported this currency. Anyway, traders are paying more attention to the USD. The support rests at 1. 05520 with resistance at 1.06560 which both lines are above the weekly pivot point at 1.04960. The EMA of 10 is moving with bullish bias along the ascendant channel and it is above EMA of 100 and below the EMA of 200. The RSI is moving above the 50 level area, the Stochastic is moving in high ranges and the MACD indicator is in positive territory. The ADX is showing a buy signal. The chart seems bearish targeting 1.050 area.

https://fxglory.com/eurusd-analysis-for-10-01-2017/


NZDUSD analysis for 09.01.2017

There were no important economic reports to influence NZDUSD. The support rests in 0.69340 with resistance at 0.69820 which the weekly pivot point at 0.69600 is located in between the lines. The EMA of 10 is moving with bearish bias and it has reached the EMA of 100 but they are both below the EMA of 200. The RSI is moving on 50 level, the MACD indicator is in positive territory and the Stochastic is moving horizontally in its minimum ranges. The ADX is showing a weak sell signal. The price has already started its bullish trend after getting close to the 61.8 level of Fibonacci. Long positions are recommended targeting 0.7050.


https://fxglory.com/nzdusd-analysis-for-09-01-2017/


GBPUSD analysis for 09.01.2017

There were no important economic reports in the great Britain so traders are now waiting for labour data and Trade Balance figures. The support rests at 1.21210 with resistance at 1.23010 which both lines are below the monthly pivot point at 1.24390. The EMA of 10 is falling down sharply and it is below the EMA of 100 and the EMA of 200. The RSI is moving in oversold area, the Stochastic is moving in its minimum rate and the MACD indicator is in neutral territory. The ADX is showing a sell signal. The pair is not going to decline more and break the support zone therefore traders can wait for the correction pattern to target 1.2400.


https://fxglory.com/gbpusd-analysis-for-09-01-2017/


EURUSD analysis for 09.01.2017

EUR is losing power due to the weak economic reports in Eurozone such as Factory Orders and Retail Sales in Germany. The support rests at 1. 0501 with resistance at 1.05530 which both lines are above the weekly pivot point at 1.04960. The EMA of 10 is falling down along the descendant channel and it is above EMA of 100 and below the EMA of 200. The RSI is moving on 50 level area, the Stochastic is moving in low ranges and the MACD indicator is in positive territory. The ADX is showing a weak sell signal. The price is above the Ichimoku Cloud and the Chinkou Span. The Tenkan-sen and the Kijun-sen are both showing horizontal trend. The resistance level breakout will push the pair to higher rates like 1.0650 otherwise, it will drop to 1.045 area.

https://fxglory.com/eurusd-analysis-for-09-01-2017/


Friday, January 6, 2017

AUDUSD analysis for 06.01.2017

There are no important economic reports in Australia therefore traders are looking at the American calendar to release US Durable Goods and US Factory Orders. The support rests in 0.72980 with resistance at 0.73540 which both lines are above the weekly pivot point at 0.72030. The EMA of 10 is moving with bullish bias and it is located above the EMA of 100 and below the EMA of 200. The RSI is moving on overbought area, the MACD indicator is in the positive territory and the Stochastic is showing downward momentum. The ADX is showing a weak buy signal. The price is above the Ichimoku Cloud and it is below the Chinkou Span. The Tenkan-sen is showing an upward trend and the Kijun-sen is showing horizontal trend. The chart seems bearish targeting 0.725 area.


https://fxglory.com/audusd-analysis-for-06-01-2017/


USDJPY analysis for 06.01.2017

USD is getting weak due to the Fed’s ambiguity about rate hike. The support rests at 115.520 with resistance at 116.400 which both lines are below the weekly pivot point at 116.940. The EMA of 10 is moving with bearish bias along the descendant channel and it is located below the EMA of 100. The RSI is rising towards the 50 level, the Stochastic is showing upward momentum and the MACD indicator is in negative territory. The ADX is showing a weak sell signal. The pair will continue its upward trend until it reaches the 61.8 of Fibonacci retracement at 117 area after that, short positions will be recommended.


https://fxglory.com/usdjpy-analysis-for-06-01-2017/


EURUSD analysis for 06.01.2017

There are no important economic reports in Eurozone to influence EURUSD therefore traders are looking at the US reports such as ADP Employment Change and US Initial Jobless Claims. The support rests at 1.05670 with resistance at 1.06010 which both lines are above the weekly pivot point at 1.05140. The EMA of 10 is rising sharply along the ascendant channel and it has crossed the EMA of 100 but they are both below the EMA of 200. The RSI is moving in overbought area, the Stochastic is showing downward momentum and the MACD indicator is in positive territory. The ADX is showing a weak buy signal. Short positions are recommended targeting 1.045 area.


https://fxglory.com/eurusd-analysis-for-06-01-2017/


Thursday, January 5, 2017

USDCAD analysis for 05.01.2017

CAD was empowered due to the Oil market reports. The pair is finding support at 1.32440 with resistance at 1.33040 which both lines are below the weekly pivot point at 1.34790. The EMA of 10 is moving with bearish bias and it is located below the EMA of 100 and above the EMA of 200. The RSI is moving in oversold area, the MACD indicator is in negative territory and the Stochastic is moving in low ranges, showing downward momentum. The ADX is showing a strong sell signal. The price has reached the 61.8 level of Fibonacci therefore it may start is upward trend soon. 1.3260 can be sellers’ next target however, the price will grow again targeting 1.3330.


https://fxglory.com/usdcad-analysis-for-05-01-2017/


GBPUSD analysis for 05.01.2017

GBP is being supported due to economic growth after the Brexit such as Construction PMI, Mortgage Approvals and Consumer Credit. The support rests at 1.22940 with resistance at 1.23640 which the weekly pivot point at 1.23100 is located in between the lines. The EMA of 10 is moving with bullish but it is below the EMA of 100 and the EMA of 200. The RSI is rising above the 50 level, the Stochastic is moving in high ranges and the MACD indicator is in neutral territory. The ADX is showing a buy signal. The price is in the Ichimoku Cloud and it is above the Chinkou Span. The Tenkan-sen is showing an upward trend and the Kijun-sen is showing horizontal trend. The pair will be fluctuating between 1.2200 to 1.2350 levels.


https://fxglory.com/gbpusd-analysis-for-05-01-2017/


EURUSD analysis for 05.01.2017

EUR is acting stronger against USD due to the Eurozone inflation rate and Positive Markit Services and Composite PMIs in Germany and France. The support rests at 1.04860 with resistance at 1.05460 which the weekly pivot point at 1.05140 is located in between the lines. The EMA of 10 is rising sharply along the ascendant channel but it is below the EMA of 100 and EMA of 200. The RSI is moving in overbought area, the Stochastic is in its highest rate and the MACD indicator is in neutral territory. The ADX is showing a strong buy signal. The price has reached the 61.8 level of Fibonacci therefore pullbacks can happen at any time soon. The pair will reach 1.0550 level but it will decline targeting 1.0350 for sellers.


https://fxglory.com/eurusd-analysis-for-05-01-2017/