
Monday, July 31, 2017
USDJPY analysis for 31.07.2017
Japan is publishing Housing Starts y/y and preliminary industrial production m/m along with the US releasing some economic data such as Pending Home Sales m/m and Chicago PMI.
The support rests at 110.240 with resistance at 111.860 which both lines are below the weekly pivot point at 111.130. The EMA of 10 is moving with bearish bias along the descendant channel and it is below the EMA of 100 and above the EMA of 200. The RSI is rising towards the 50 level, the Stochastic is moving in low ranges and the MACD indicator is in negative territory. The ADX is not showing any clear signals.
The resistance level breakout will smooth the way for further growth otherwise the pair will drop to 109.8.
https://fxglory.com/usdjpy-analysis-for-31-07-2017/

USDCHF analysis for 31.07.2017
There are no major economic reports in Switzerland however the US is releasing Chicago PMI and Pending Home Sales YoY.
The support rests at 0.96420 with resistance at 0.97040 which both lines are above the weekly pivot point at 0.96190. The EMA of 10 is moving with bullish bias along the ascendant channel and it is located above the EMA of 200 and the EMA of 100. The RSI is moving horizontally in the overbought area, the MACD indicator is in positive territory and the Stochastic is moving in low ranges. The ADX is not showing any clear signals. The price is above the Ichimoku Cloud and below the Chinkou Span. The Tenkan-sen is showing an upward trend while the Kijun-sen is showing a horizontal trend.
Long positions are recommended targeting 0.98 area.
https://fxglory.com/usdchf-analysis-for-31-07-2017/


EURUSD analysis for 31.07.2017
The US data did not support USD and today there are Unemployment Rate data in Eurozone along with pending home sales m/m and Chicago PMI in the US.
The support rests at 1.17230 with resistance at 1.17530 which both lines are above the weekly pivot point at 1.17110. The EMA of 10 is moving with bullish bias along the ascendant channel and it is above the EMA of 200 and the EMA of 100. The RSI is falling towards the 50 level, the Stochastic is showing downward momentum and the MACD indicator is in positive territory. The ADX is not showing any clear signals.
It seems that the pair has started its correction pattern heading downwards therefore short positions are recommended targeting 1.164.
https://fxglory.com/eurusd-analysis-for-31-07-2017/


Thursday, July 27, 2017
USDJPY analysis for 27.07.2017
There are no economic reports in Japan however the US is releasing Natural Gas Storage, Prelim Wholesale Inventories m/m, Goods Trade Balance, Durable Goods Orders m/m, Unemployment Claims and Core Durable Goods Orders m/m.
The support rests at 110.660 with resistance at 111.260 which both lines are below the weekly pivot point at 111.660. The EMA of 10 is moving with bearish bias along the descendant channel and it is below the EMA of 100 and above the EMA of 200. The RSI is rising towards 50 level, the Stochastic is moving in low ranges and the MACD indicator is in negative territory. The ADX is not showing any signals.
It seems that the pair will continue its bearish trend towards 110.29.
https://fxglory.com/usdjpy-analysis-for-27-07-2017/


EURUSD analysis for 27.07.2017
FOMC meeting minutes has been the most influential event for this week.
The support rests at 1.16930 with resistance at 1.17760 which both lines are above the weekly pivot point at 1.15930. The EMA of 10 is moving with bullish bias along the ascendant channel and it is above the EMA of 200 and the EMA of 100. The RSI is moving horizontally in the overbought area, the Stochastic is moving in high ranges and the MACD indicator is in positive territory. The ADX is showing buy signals.
Long positions are recommended targeting 1.1850.
https://fxglory.com/eurusd-analysis-for-27-07-2017/


AUDUSD analysis for 27.07.2017
AUD was weakened due to the Australian consumer inflation data and dovish talk from a Reserve Bank of Australia official.
The support rests at 0.80150 with resistance at 0.80790 which both lines are above the weekly pivot point at 0.78960. The EMA of 10 is moving with bullish bias along the ascendant channel and it is above the EMA of 100 and the EMA of 200. The RSI is moving in overbought area, the MACD indicator is in positive territory and the Stochastic is moving in high ranges. The ADX is showing buy signals. The price is above the Ichimoku Cloud and below the Chinkou Span. The Tenkan-sen and the Kijun-sen are both showing an upward trend.
Despite the bullish signals presented by the indicators, it seems that the resistance area is too strong to be broken therefore short positions are recommended targeting 0.78.
https://fxglory.com/audusd-analysis-for-27-07-2017/


Wednesday, July 26, 2017
NZDUSD analysis for 26.07.2017
New Zealand is releasing Balance of Trade along with the US publishing New Home Sales and Fed Interest Rate Decision.
The support rests in 0.74100 with resistance at 0.74400 which both lines are above the weekly pivot point at 0.73910. The EMA of 10 is moving horizontally and it is above the EMA of 200 and below the EMA of 100. The RSI is falling towards the 50 level, the MACD indicator is in positive territory and the Stochastic is showing downward momentum. The ADX is not showing any clear signals. The price is above the Ichimoku Cloud and below the Chinkou Span. The Tenkan-sen and the Kijun-sen are both showing a horizontal trend.
Short positions are recommended targeting 0.7350.
https://fxglory.com/nzdusd-analysis-for-26-07-2017/


GBPUSD analysis for 26.07.2017
While USD is being empowered, GBPUSD is chiefly under the influence of FOMC meeting minutes and the FED economic and monetary policy.
The support rests at 1.29920 with resistance at 1.30370 which the weekly pivot point at 1.30170 is located in between the lines. The EMA of 10 is moving with bearish bias but it is above the EMA of 200 and the EMA of 100. The RSI is moving horizontally on the 50 level, the Stochastic is showing downward momentum and the MACD indicator is in neutral territory. The ADX is showing sell signals.
The support are of 1.29 level seems to be too strong to be broken therefore GBPUSD may continue its bullish trend towards 1.31.
https://fxglory.com/gbpusd-analysis-for-26-07-2017/


EURUSD analysis for 26.07.2017
The US strong consumer confidence data supported USD however it was not enough to start the correction pattern.
The support rests at 1.16180 with resistance at 1.16580 which both lines are above the weekly pivot point at 1.15930. The EMA of 10 is moving with bullish bias along the ascendant channel and it is above the EMA of 200 and the EMA of 100. The RSI is moving horizontally on the 50 level, the Stochastic is moving in low ranges and the MACD indicator is in positive territory. The ADX is showing buy signals.
Despite the USD effort to drag the price down, the pair is growing up towards 1.17.
https://fxglory.com/eurusd-analysis-for-26-07-2017/


Friday, July 21, 2017
USDJPY analysis for 21.07.2017
There are no economic reports in the US or Japan to influence USDJPY therefore the market will have low volatility.
The support rests at 111.730 with resistance at 112.170 which both lines are below the weekly pivot point at 113.080. The EMA of 10 is moving with bearish bias along the descendant channel and it is below the EMA of 100 and above the EMA of 200. The RSI is moving horizontally below the 50 level, the Stochastic is moving in middle ranges and the MACD indicator is in negative territory. The ADX is not showing any clear signals.
Short positions are recommended towards 111.
https://fxglory.com/usdjpy-analysis-for-21-07-2017/


Gold analysis for 21.07.2017
Gold has been growing up since the middle of July.
The support rests at 1241.75 with resistance at 1247.91 which both lines are above the weekly pivot point at 1221.40. The EMA of 10 is moving with bullish bias along the ascendant channel and it is below the EMA of 200 and above the EMA of 100. The RSI is moving horizontally in the overbought area, the Stochastic is moving in high ranges and the MACD indicator is in positive territory. The ADX is showing buy signals. The price is above the Ichimoku Cloud and the Chinkou Span. The Tenkan-sen is showing a horizontal trend and the Kijun-sen is showing an upward trend.
Gold will continue its bullish trend targeting 1254.56.
https://fxglory.com/gold-analysis-for-21-07-2017/


EURUSD analysis for 21.07.2017
Draghi press conference could not take the price down since EUR was being empowered by the economic reports and USD was still weak.
The support rests at 1.16150 with resistance at 1.16430 which both lines are above the weekly pivot point at 1.14420. The EMA of 10 is moving with bullish bias along the ascendant channel and it is above the EMA of 200 and the EMA of 100. The RSI is moving horizontally in the overbought area, the Stochastic is moving in high ranges and the MACD indicator is in positive territory. The ADX is not showing any clear signals.
Long positions are recommended targeting 1.1850.
https://fxglory.com/eurusd-analysis-for-21-07-2017/


Monday, July 17, 2017
USDJPY analysis for 17.07.2017
There are no economic reports in Japan therefore USDJPY will be chiefly under the influence of Empire State Manufacturing Index data.
The support rests at 112.340 with resistance at 112.780 which both lines are below the weekly pivot point at 113.080. The EMA of 10 is moving with bearish bias along the descendant channel and it is above the EMA of 100 and the EMA of 200. The RSI is moving horizontally above the oversold area, the Stochastic is showing upward momentum and the MACD indicator is in negative territory. The ADX is not showing any clear signals.
It seems that 112.34 level of support is too strong to be broken therefore long positions are recommended targeting 114 area.
https://fxglory.com/usdjpy-analysis-for-17-07-2017/


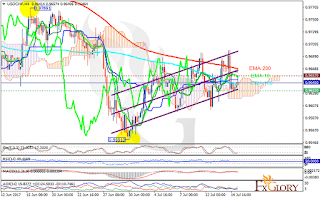
USDCHF analysis for 17.07.2017
USDCHF has been growing up with high volatility since the beginning of July.
The support rests at 0.96320 with resistance at 0.96570 which the weekly pivot point at 0.96450 is located in between the lines. The EMA of 10 is moving with bearish bias and it is located below the EMA of 200 and above the EMA of 100. The RSI is moving horizontally on the 50 level, the MACD indicator is in neutral territory and the Stochastic is moving in low ranges. The ADX is showing buy signals. The price is in the Ichimoku Cloud and above the Chinkou Span. The Tenkan-sen and the Kijun-sen are both showing a horizontal trend.
Long positions are recommended targeting 0.9770.
https://fxglory.com/usdchf-analysis-for-17-07-2017/
EURUSD analysis for 17.07.2017
EURUSD was empowered due to the weak economic reports in the US on Friday. There are no major economic reports in Eurozone or the US to influence this pair.
The support rests at 1.14450 with resistance at 1.14720 which both lines are above the monthly pivot point at 1.13280. The EMA of 10 is moving with bullish bias along the ascendant channel and it is above the EMA of 200 and the EMA of 100. The RSI is falling towards the 50 level, the Stochastic is moving in high ranges and the MACD indicator is in positive territory. The ADX is not showing any clear signals. Pullbacks can drag the pair towards 1.140 area however the pair will continue its long term growth.
https://fxglory.com/eurusd-analysis-for-17-07-2017/


Monday, July 10, 2017
USDJPY analysis for 10.07.2017
USDJPY is under the influence of some economic reports such as Economy Watchers Sentiment, Current Account, Core Machinery Orders m/m and Bank Lending y/y data in Japan and Consumer Credit m/m and Labor Market Conditions Index m/m in the US.
The support rests at 114.030 with resistance at 114.350 which both lines are above the weekly pivot point at 113.380. The EMA of 10 is moving with bullish bias along the ascendant channel and it is above the EMA of 100 and the EMA of 200. The RSI is moving in overbought area, the Stochastic is moving in high ranges and the MACD indicator is in positive territory. The ADX is showing buy signals.
Bulls are controlling the chart therefore buyers can target 115.
https://fxglory.com/usdjpy-analysis-for-10-07-2017/


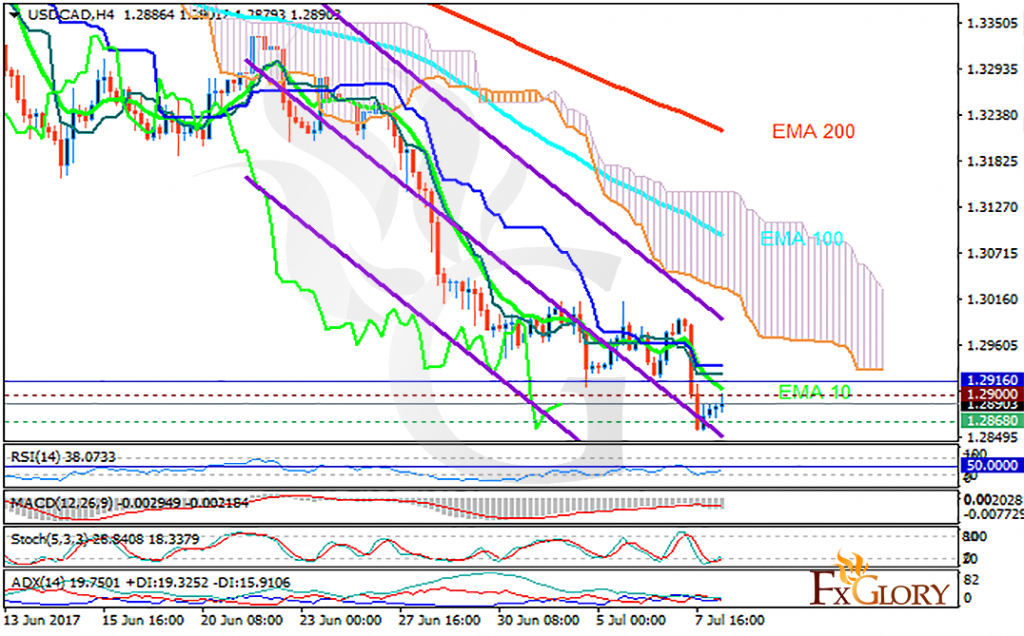
USDCAD analysis for 10.07.2017
The oil market is putting pressure on CAD, on the other hand, CAD is being supported by the Canadian employment report.
The pair is finding support at 1.28680 with resistance at 1.29000 which both lines are below the weekly pivot point at 1.29160. The EMA of 10 is moving with bearish bias along the descendant channel and it is below the EMA of 100 and the EMA of 200. The RSI is rising towards the 50 level, the MACD indicator is in negative territory and the Stochastic is showing upward momentum. The ADX is not showing any clear signals. The price is below the Ichimoku Cloud and above the Chinkou Span. The Tenkan-sen and the Kijun-sen are both showing a horizontal trend.
The resistance level breakout will smooth the way for further growth towards 1.31 otherwise it will drop to 1.25
https://fxglory.com/usdcad-analysis-for-10-07-2017/

EURUSD analysis for 10.07.2017
Europe is releasing Balance of Trade along with the US publishing Fed Labor Market Conditions Index (MoM).
The support rests at 1.13900 with resistance at 1.14120 which both lines are above the monthly pivot point at 1.13280. The EMA of 10 is moving with bullish bias along the ascendant channel and it is above the EMA of 100 and the EMA of 200. The RSI is moving above the 50 level, the Stochastic is showing upward momentum and the MACD indicator is in positive territory. The ADX is not showing any clear signals.
Long positions are recommended targeting 1.144 area.
https://fxglory.com/eurusd-analysis-for-10-07-2017/


Friday, July 7, 2017
Gold analysis for 07.07.2017
Gold is under pressure due to the Bank of Canada and England decision regarding monetary policy.
The support rests at 1217.64 with resistance at 1223.96 which both lines are below the weekly pivot point at 1245.93. The EMA of 10 is moving horizontally and it is below the EMA of 200 and below the EMA of 100. The RSI is moving below the 50 level, the Stochastic is showing downward momentum and the MACD indicator is in negative territory. The ADX is not showing any clear signals. The price is below the Ichimoku Cloud and above the Chinkou Span. The Tenkan-sen is showing a horizontal trend while the Kijun-sen is showing a downward trend.
Short positions are recommended targeting 1200.
https://fxglory.com/gold-analysis-for-07-07-2017/


GBPUSD analysis for 07.07.2017
The UK is releasing the manufacturing production data and the US is publishing the NFP and the wages data.
The support rests at 1.29430 with resistance at 1.29790 which both lines are above the weekly pivot point at 1.29200. The EMA of 10 is moving with bullish bias along the ascendant channel and it is above the EMA of 200 and the EMA of 100. The RSI is falling towards the 50 level, the Stochastic is moving in high ranges and MACD indicator is in neutral territory. The ADX is not showing any clear signals.
The support level breakthrough will smooth the way for further decline towards 1.26, Otherwise the pair will rise towards 1.30.
https://fxglory.com/gbpusd-analysis-for-07-07-2017/


EURUSD analysis for 07.07.2017
While EUR is being empowered by the economic reports in Eurozone, USD is getting weak due to the reports in the US.
The support rests at 1.13980 with resistance at 1.14320 which both lines are above the weekly pivot point at 1.13460. The EMA of 10 is moving with bullish bias along the ascendant channel and it is above the EMA of 200 and the EMA of 100. The RSI is moving horizontally above the 50 level, the Stochastic is moving in high ranges and the MACD indicator is in positive territory. The ADX is not showing any clear signals.
Long positions are recommended targeting 1.15.
https://fxglory.com/eurusd-analysis-for-07-07-2017/


Thursday, July 6, 2017
USDJPY analysis for 06.07.2017
Japan is releasing 30-y Bond Auction data and the US is publishing Crude Oil Inventories, ISM Non-Manufacturing PMI, Final Services PMI, Trade Balance, Unemployment Claims.
The support rests at 112.880 with resistance at 113.420 which both lines are above the weekly pivot point at 112.130. The EMA of 10 is moving with bullish bias along the ascendant channel and it is above the EMA of 100 and the EMA of 200. The RSI is moving horizontally on the 50 level, the Stochastic is showing downward momentum and the MACD indicator is in positive territory. The ADX is not showing any clear signals.
Long positions are recommended targeting 114.
https://fxglory.com/usdjpy-analysis-for-06-07-2017/


EURUSD analysis for 06.07.2017
Today ADP Employment change, the PMI data and the oil inventory data will be released from the US.
The support rests at 1.13310 with resistance at 1.13610 which the weekly pivot point at 1.13460 is located in between the lines. The EMA of 10 is moving horizontally but it is above the EMA of 200 and the EMA of 100. The RSI is moving horizontally on the 50 level, the Stochastic is showing upward momentum and the MACD indicator is in neutral territory. The ADX is not showing any clear signals.
The 1.133 level of support is too strong therefore the price will rise towards the 61.8 level of Fibonacci.
https://fxglory.com/eurusd-analysis-for-06-07-2017/


AUDUSD analysis for 06.07.2017
AUDUSD is chiefly under the influence of some economic data such as Balance of Trade in Australia and ADP Employment Change in the US.
The support rests at 0.75730 with resistance at 0.76230 which both lines are below the weekly pivot point at 0.76530. The EMA of 10 is moving with bearish bias and it has reached the EMA of 100 which both are above the EMA of 200. The RSI is rising towards the 50 level, the MACD indicator is in negative territory and the Stochastic is showing upward momentum. The ADX is not showing any clear signals. The price is below the Ichimoku Cloud and the Chinkou Span. The Tenkan-sen is showing a horizontal trend while the Kijun-sen is showing a downward trend.
The resistance level breakout will smooth the way for further growth targeting 0.77.
https://fxglory.com/11036/


Wednesday, July 5, 2017
NZDUSD analysis for 05.07.2017
NZDUSD will be volatile due to the Federal Reserve Meeting Minutes today.
The support rests at 0.72670 with resistance at 0.72970 which both lines are below the weekly pivot point at 0.73090. The EMA of 10 is moving with bearish bias but it is above the EMA of 100 and 200. The RSI is rising towards the 50 level, the MACD indicator is in negative territory and the Stochastic is showing downward momentum. The ADX is showing sell signals. The price is in the Ichimoku Cloud and above the Chinkou Span. The Tenkan-sen is showing a downward trend while the Kijun-sen is showing a horizontal trend.
Regardless of the price decline signals presented by the indicators, 0.726 level seems to be too strong to be broken therefore, the pair will continue its growth in long term trading targeting 0.73.
https://fxglory.com/nzdusd-analysis-for-05-07-2017/


GBPUSD analysis for 05.07.2017
The FOMC is releasing today along with the Services PMI data from the UK.
The support rests at 1.29050 with resistance at 1.29570 which the weekly pivot point at 1.29200 is located in between the lines. The EMA of 10 is moving with bearish bias along the descendant channel but it is above the EMA of 200 and the EMA of 100. The RSI is moving horizontally on the 50 level, the Stochastic is moving in low ranges and MACD indicator is in neutral territory. The ADX is showing weak sell signals.
1.290 level seems to be a strong supportive area therefore long positions are recommended targeting 1.3050.
https://fxglory.com/gbpusd-analysis-for-05-07-2017/


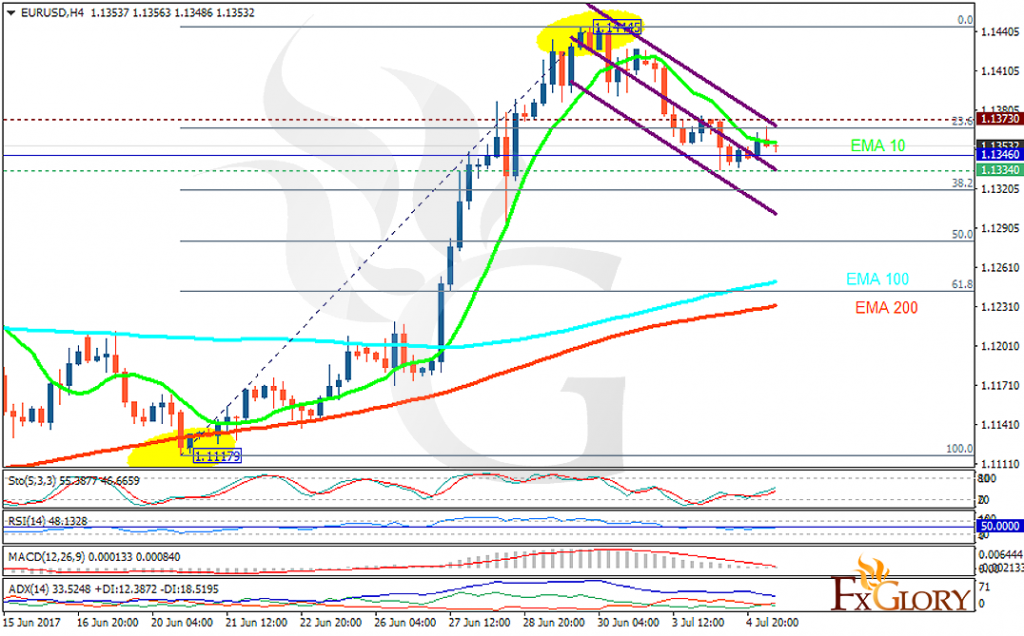
EURUSD analysis for 05.07.2017
EURUSD is chiefly under the influence of some economic reports such as Retail Sales m/m, Final Services PMI and German, French and Italian Final Services PMI in Eurozone along with the IBD/TIPP Economic Optimism and Factory Orders m/m in the US.
The support rests at 1.13340 with resistance at 1.13730 which the weekly pivot point at 1.13460 is located in between the lines. The EMA of 10 is moving with bearish bias along the descendant channel but it is above the EMA of 200 and the EMA of 100. The RSI is moving horizontally on the 50 level, the Stochastic is showing upward momentum and the MACD indicator is in neutral territory. The ADX is not showing any clear signals.
Short positions are recommended towards the 61.8 level of Fibonacci.
https://fxglory.com/eurusd-analysis-for-05-07-2017/

Tuesday, July 4, 2017
USDJPY analysis for 04.07.2017
Japan is releasing BOJ Core CPI y/y, 10-y Bond Auction and Monetary Base y/y data.
The support rests at 112.460 with resistance at 113.250 which both lines are above the weekly pivot point at 112.130. The EMA of 10 is moving with bullish bias along the ascendant channel and it is above the EMA of 100 and the EMA of 200. The RSI is falling towards the 50 level, the Stochastic is showing downward momentum and the MACD indicator is in positive territory. The ADX is not showing any clear signals.
Regardless of several pullbacks, the upward trend will continue towards 115 area.
https://fxglory.com/usdjpy-analysis-for-04-07-2017/


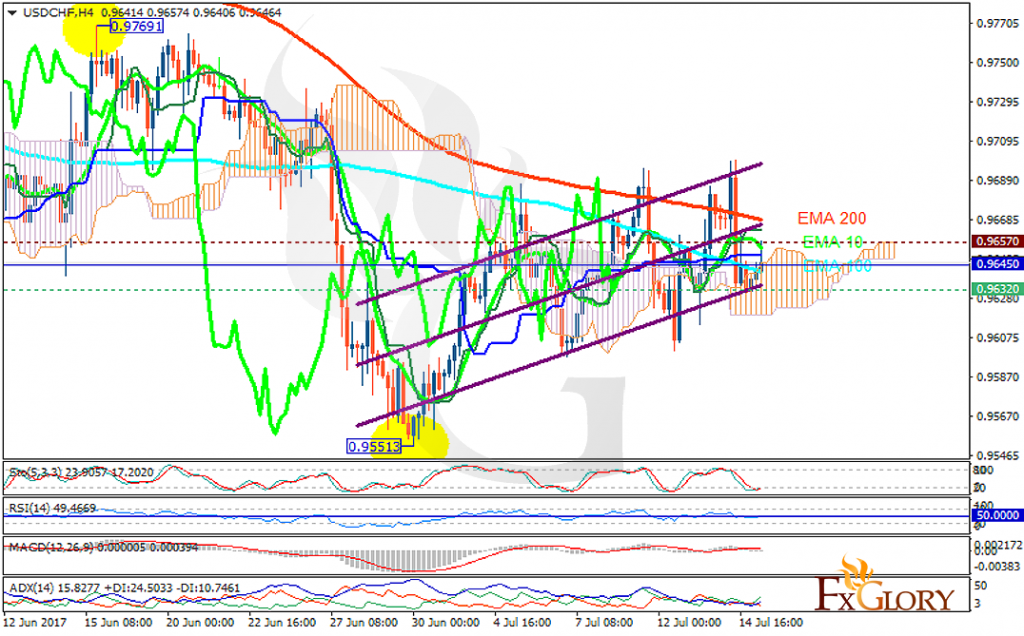
USDCHF analysis for 04.07.2017
There are no economic reports in the US due to the holiday.
The support rests at 0.96150 with resistance at 0.96410 which the weekly pivot point at 0.96250 is located in between the lines. The EMA of 10 is moving with bullish bias but it is located below the EMA of 200 and the EMA of 100. The RSI is moving horizontally on the 50 level, the MACD indicator is in neutral territory and the Stochastic is showing downward momentum. The ADX is showing buy signals. The price is in the Ichimoku Cloud and below the Chinkou Span. The Tenkan-sen is showing an upward trend while the Kijun-sen is showing a horizontal trend.
Long positions are recommended targeting 0.97.
https://fxglory.com/usdchf-analysis-for-04-07-2017/


EURUSD analysis for 04.07.2017
Due to the US holiday, the market is moving very slowly and the only influential economic event is ECB Praet Speech in Eurozone.
The support rests at 1.13360 with resistance at 1.13760 which the weekly pivot point at 1.13460 is located in between the lines. The EMA of 10 is moving with bearish bias along the descendant channel but it is above the EMA of 200 and the EMA of 100. The RSI is moving horizontally on the 50 level, the Stochastic is showing upward momentum and the MACD indicator is in positive territory. The ADX is showing poor sell signals.
EURUSD will continue its downward trend towards the 61.8 level of Fibonacci retracement.
https://fxglory.com/eurusd-analysis-for-04-07-2017/


Subscribe to:
Posts (Atom)