
Friday, December 22, 2017
USDJPY analysis for 22.12.2017
While Japan did not release any economic data, the US will publish various economic reports such as Revised UoM Inflation Expectations, Revised UoM Consumer Sentiment, New Home Sales, Personal Income m/m, Personal Spending m/m, Durable Goods Orders m/m, Core PCE Price Index m/m and Core Durable Goods Orders m/m.
The support rests at 113.240 with resistance at 113.570 which both lines are above the weekly pivot point at 112.790. The EMA of 10 is moving with bullish bias in the ascendant channel and it is above the EMA of 200 and the EMA of 100. The RSI is moving above the 50 level, the Stochastic is moving in low ranges and the MACD line is on the signal line in the neutral territory. The ADX is showing buy signal.
Long positions are recommended towards 114.
https://fxglory.com/usdjpy-analysis-for-22-12-2017/

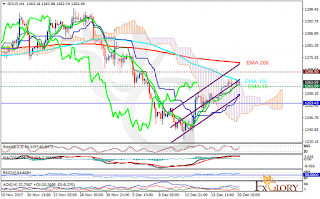
USDCAD analysis for 22.12.2017
Canada will release GDP MoM and Budget Balance and the US will publish New Home Sales, Personal Income and Spending MoM and Durable Goods Orders MoM.
The pair is finding support at 1.26970 with resistance at 1.27470 which both lines are below the weekly pivot point at 1.28250. The EMA of 10 is moving with bearish bias in the descendant channel and it is located below the EMA of 200 and the EMA of 100. The RSI is moving in oversold area, the MACD line is below the signal line in the negative territory and the Stochastic is moving in low ranges. The ADX is showing sell signals. The price is below the Ichimoku Cloud and the Chinkou Span. The Tenkan-sen is showing a downward trend while the Kijun-sen is showing a horizontal trend.
The support level breakthrough will push the price down towards 1.25.
https://fxglory.com/usdcad-analysis-for-22-12-2017/


EURUSD analysis for 22.12.2017
EUR is under pressure due to the Catalonia election in Spain and that is the reason of EURUSD decline towards 1.185 again.
The support rests at 1.18380 with resistance at 1.18620 which both lines are above the weekly pivot point at 1.17760. The EMA of 10 is moving with bullish bias in the ascendant channel and it is above the EMA of 200 and the EMA of 100. The RSI is moving on the 50 level, the Stochastic is moving in middle ranges and the MACD line is below the signal line in the negative territory. The ADX is not showing any clear signals.
The pair will continue its bullish trend towards the upper Bollinger band targeting 1.20.
https://fxglory.com/eurusd-analysis-for-22-12-2017/


Thursday, December 21, 2017
USDCHF analysis for 21.12.2017
Switzerland has published Balance of Trade and the US will release GDP Growth Rate QoQ Final.
The support rests at 0.98520 with resistance at 0.98700 which both lines are below the weekly pivot point at 0.98930. The EMA of 10 is moving horizontally in the descendant channel and it is located below the EMA of 200 and the EMA of 100. The RSI is rising towards the 50 level, the MACD line is above the signal line in the positive territory and the Stochastic is moving in middle ranges. The ADX is not showing any clear signals. The price is below the Ichimoku Cloud and above the Chinkou Span. The Tenkan-sen and the Kijun-sen are both showing a horizontal trend.
Long positions are recommended towards 0.99.
https://fxglory.com/usdchf-analysis-for-21-12-2017/


GBPUSD analysis for 21.12.2017
Despite various economic developments in the US, GBP did not move much.
The support rests at 1.33520 with resistance at 1.33790 which the weekly pivot point at 1.33600 is located in between the lines. The EMA of 10 is moving horizontally in the channel and it is above the EMA of 200 and below the EMA of 100. The RSI is moving below the 50 level, the Stochastic is moving in low ranges and MACD line is below the signal line in the negative territory. The ADX is showing sell signal.
The indicators are not showing any strong signals therefore the price will be fluctuating within 1.33 and 1.34 areas.
https://fxglory.com/gbpusd-analysis-for-21-12-2017/


EURUSD analysis for 21.12.2017
The tax reform bill and the strong US economic data could not support USD.
The support rests at 1.18540 with resistance at 1.18890 which both lines are above the weekly pivot point at 1.17760. The EMA of 10 is moving with bullish bias in the ascendant channel and it is above the EMA of 200 and the EMA of 100. The RSI is moving in overbought area, the Stochastic is moving in middle ranges and the MACD line is above the signal line in the positive territory. The ADX is showing buy signals.
Considering pullbacks on the way, long positions are recommended towards 1.197.
https://fxglory.com/eurusd-analysis-for-21-12-2017/


Wednesday, December 20, 2017
USDJPY analysis for 20.12.2017
Japan has released All Industries Activity m/m data and the US will publish Crude Oil Inventories and Existing Home Sales.
The support rests at 112.620 with resistance at 113.280 which the weekly pivot point at 112.790 is located in between the lines. The EMA of 10 is moving with bullish bias in the ascendant channel and it is above the EMA of 200 and the EMA of 100. The RSI is rising towards the overbought area, the Stochastic is moving in high ranges and the MACD line is above the signal line in the positive territory. The ADX is showing buy signal.
The price may grow towards the resistance area, but it will drop to lower Bollinger band towards 112.
https://fxglory.com/usdjpy-analysis-for-20-12-2017/


Gold analysis for 20.12.2017
If the US dollar stays weak, Gold will continue its bullish trend.
The support rests at 1261.50 with resistance at 1268.50 which both lines are above the weekly pivot point at 1253.43. The EMA of 10 is moving with bullish bias in the ascendant channel and it is below the EMA of 200 and the EMA of 100. The RSI is moving in overbought area, the Stochastic is showing upward momentum and the MACD line is above the signal line in the positive territory. The ADX is showing buy signal. The price is above the Ichimoku Cloud and the Chinkou Span. The Tenkan-sen and the Kijun-sen are both showing an upward trend.
Long positions are recommended towards 1275.
https://fxglory.com/gold-analysis-for-20-12-2017/

EURUSD analysis for 20.12.2017
EURUSD is moving with bullish bias and today the existing home sales data from the US is the only influential even for this pair.
The support rests at 1.17940 with resistance at 1.18500 which both lines are above the weekly pivot point at 1.17760. The EMA of 10 is moving with bullish bias in the ascendant channel and it is above the EMA of 200 and the EMA of 100. The RSI is moving in overbought area, the Stochastic is showing upward momentum and the MACD line is above the signal line in the positive territory. The ADX is showing buy signals.
Long positions are recommended towards 1.19.
https://fxglory.com/eurusd-analysis-for-20-12-2017/


Tuesday, December 19, 2017
GBPUSD analysis for 19.12.2017
The Brexit talks are again back to the negotiations and the US tax reform bill is leaving impacts on GBPUSD.
The support rests at 1.33210 with resistance at 1.34040 which the weekly pivot point at 1.33600 is located in between the lines. The EMA of 10 is moving with bullish bias in the descendant channel and it is above the EMA of 200 and below the EMA of 100. The RSI is moving on the 50 level, the Stochastic is showing downward momentum and MACD line is on the signal line in the neutral territory. The ADX is showing buy signal.
The price is growing towards the upper Bollinger band targeting 1.348.
https://fxglory.com/gbpusd-analysis-for-19-12-2017/


EURUSD analysis for 19.12.2017
The US tax reform bill is losing its power over the EURUSD chart and today this pair will be chiefly under the influence of building permits data from the US.
The support rests at 1.17660 with resistance at 1.18140 which the weekly pivot point at 1.17760 is located in between the lines. The EMA of 10 is moving horizontally in the ascendant channel and it is above the EMA of 200 and below the EMA of 100. The RSI is rising towards the overbought area, the Stochastic is showing upward momentum and the MACD line is above the signal line in the positive territory. The ADX is showing buy signals.
Long positions are recommended towards the 61.8 level of Fibonacci at 1.185 and later 1.19.
https://fxglory.com/eurusd-analysis-for-19-12-2017/


AUDUSD analysis for 19.12.2017
Australia has published RBA Meeting Minutes and the US will release Housing Starts and Building Permits.
The support rests at 0.76500 with resistance at 0.76880 which both lines are above the weekly pivot point at 0.76120. The EMA of 10 is moving with bullish bias along the ascendant channel but it is above the EMA of 100 and the EMA of 200. The RSI is rising towards the overbought area, the MACD line is below the signal line in the negative territory and the Stochastic is showing upward momentum. The ADX is showing buy signal. The price is above the Ichimoku Cloud and the Chinkou Span. The Tenkan-sen and the Kijun-sen are both showing an upward trend.
AUDUSD will continue its bullish trend towards 0.775.
https://fxglory.com/audusd-analysis-for-19-12-2017/


Monday, December 18, 2017
USDJPY analysis for 18.12.2017
Japan has released Trade Balance data and the US will publish NAHB Housing Market Index.
The support rests at 112.500 with resistance at 112.870 which the weekly pivot point at 112.790 is located in between the lines. The EMA of 10 is moving with bearish bias in the ascendant channel and it is below the EMA of 200 and the EMA of 100. The RSI is moving on the 50 level, the Stochastic is showing downward momentum and the MACD line is above the signal line in the positive territory. The ADX is not showing any clear signals.
The pair will grow along the Andrews’ Pitchfork towards 112.8 but it will drop to 111.5.
https://fxglory.com/usdjpy-analysis-for-18-12-2017/


NZDUSD analysis for 18.12.2017
New Zealand has published ANZ Roy Morgan Consumer Confidence and the US will release NAHB Housing Market Index.
The support rests at 0.69840 with resistance at 0.70350 which both lines are above the weekly pivot point at 0.69480. The EMA of 10 is moving with bullish bias in the ascendant channel and it is above the EMA of 200 and the EMA of 100. The RSI is falling towards the oversold area, the MACD line is below the signal line in the negative territory and the Stochastic is moving in middle. The ADX is showing buy signal. The price is above the Ichimoku Cloud and below the Chinkou Span. The Tenkan-sen and the Kijun-sen are both showing an upward trend.
Long positions are recommended towards 0.73.
https://fxglory.com/nzdusd-analysis-for-18-12-2017/


EURUSD analysis for 18.12.2017
The tax reform plan has been the most influential event for EURUSD. Today this pair will consolidate due to lack of economic reports in Eurozone.
The support rests at 1.17500 with resistance at 1.18340 which the weekly pivot point at 1.17760 is located in between the lines. The EMA of 10 is moving with bearish bias in the descendant channel and it is above the EMA of 200 and below the EMA of 100. The RSI is rising towards the 50 level, the Stochastic is showing upward momentum and the MACD line is below the signal line in the negative territory. The ADX is showing buy signals.
The resistance area seems to be too strong to be broken, therefore the pair may rise towards the upper Bollinger band but it will soon drop to 1.1730.
https://fxglory.com/eurusd-analysis-for-18-12-2017/


Friday, December 15, 2017
USDCAD analysis for 15.12.2017
Canada is releasing Manufacturing Sales MoM and New Motor Vehicle Sales and the US will publish Industrial Production YoY and Foreign Bond Investment.
The pair is finding support at 1.27200 with resistance at 1.27930 which the weekly pivot point at 1.27800 is located in between the lines. The EMA of 10 is moving with bearish bias in the descendant channel and it is located above the EMA of 200 and the EMA of 100. The RSI is falling towards the oversold area, the MACD line is below the signal line in the negative territory and the Stochastic is moving in middle ranges. The ADX is showing sell signals. The price is below the Ichimoku Cloud and the Chinkou Span. The Tenkan-sen is showing a downward trend while the Kijun-sen is showing a horizontal trend.
The support level breakthrough will push the price down towards 1.26 otherwise it will grow to 1.28.
https://fxglory.com/usdcad-analysis-for-15-12-2017/


GBPUSD analysis for 15.12.2017
The Brexit talks are supporting GBP and the USD is also supported by the economic reports.
The support rests at 1.33450 with resistance at 1.34540 which the weekly pivot point at 1.34110 is located in between the lines. The EMA of 10 is moving with bullish bias in the ascendant channel and it is above the EMA of 200 and the EMA of 100. The RSI is falling towards the 50 level, the Stochastic is showing upward momentum and MACD line is above the signal line in the positive territory. The ADX is showing weak buy signals.
Long positions are recommended towards 1.35.
https://fxglory.com/gbpusd-analysis-for-15-12-2017/


EURUSD analysis for 15.12.2017
Yesterday retail sales data supported USD and push the price down towards 1.17 area.
The support rests at 1.17720 with resistance at 1.18350 which the weekly pivot point at 1.17920 is located in between the lines. The EMA of 10 is moving with bullish bias in the descendant channel and it is above the EMA of 200 and below the EMA of 100. The RSI is moving on the 50 level, the Stochastic is moving in low ranges and the MACD line is on the signal line in the neutral territory. The ADX is not showing any clear signals.
Short positions are recommended towards 1.16 area, buyers can enter the market when the price reaches 1.19.
https://fxglory.com/eurusd-analysis-for-15-12-2017/


Thursday, December 14, 2017
USDJPY analysis for 14.12.2017
Japan has published Revised Industrial Production m/m and the US will release Natural Gas Storage, Flash Services PMI, Flash Manufacturing PMI, Unemployment Claims, Retail Sales m/m and Core Retail Sales m/m.
The support rests at 112.460 with resistance at 112.860 which both lines are below the weekly pivot point at 113.010. The EMA of 10 is moving with bearish bias in the descendant channel but it is above the EMA of 200 and the EMA of 100. The RSI is rising towards the 50 level, the Stochastic is moving in low ranges and the MACD line is below the signal line in the negative territory. The ADX is showing sell signal.
The price may continue its bearish trend towards the 61.8 level of Fibonacci at 111.9.
https://fxglory.com/usdjpy-analysis-for-14-12-2017/


USDCHF analysis for 14.12.2017
Switzerland has published Producer and Import Prices YoY and SNB Interest Rate Decision and the US will release Retail Sales MoM and Initial Jobless Claims.
The support rests at 0.98340 with resistance at 0.98650 which both lines are below the weekly pivot point at 0.98960. The EMA of 10 is moving with bearish bias in the descendant channel but it is located below the EMA of 200 and above the EMA of 100. The RSI is rising towards the 50 level, the MACD line is below the signal line in the negative territory and the Stochastic is moving in low ranges. The ADX is showing sell signal. The price is in the Ichimoku Cloud and above the Chinkou Span. The Tenkan-sen and the Kijun-sen are both showing a horizontal trend.
The pair may rise towards 0.99 but it will fall in long term targeting 0.98.
https://fxglory.com/usdchf-analysis-for-14-12-2017/


EURUSD analysis for 14.12.2017
EUR is acting strong against the weak USD. The ECB press conference today may also give more power to EUR.
The support rests at 1.18030 with resistance at 1.18480 which both lines are above the weekly pivot point at 1.17920. The EMA of 10 is moving with bullish bias in the ascendant channel and it is above the EMA of 200 and below the EMA of 100. The RSI falling towards the 50 level, the Stochastic is moving in high ranges and the MACD line is above the signal line in the positive territory. The ADX is not showing any clear signals.
Long positions are recommended towards 1.20.
https://fxglory.com/eurusd-analysis-for-14-12-2017/


Wednesday, December 13, 2017
Gold analysis for 13.12.2017
Gold traders must watch out for the US rate hike plan for 2018.
The support rests at 1238.94 with resistance at 1248.27 which both lines are below the weekly pivot point at 1257.77. The EMA of 10 is moving with bearish bias in the descendant channel and it is below the EMA of 200 and the EMA of 100. The RSI is moving in oversold area, the Stochastic is showing upward momentum and the MACD line is above the signal line in the positive territory. The ADX is showing sell signals. The price is below the Ichimoku Cloud and the Chinkou Span. The Tenkan-sen and the Kijun-sen are both showing a downward trend.
Long positions are recommended towards 1255.
https://fxglory.com/gold-analysis-for-13-12-2017/


GBPUSD analysis for 13.12.2017
The lack of fundamental news was keeping GBP quiet, even the strong CPI data could not leave any impact on this currency. Today the US will release FOMC and the inflation data.
The support rests at 1.33050 with resistance at 1.33450 which both lines are below the weekly pivot point at 1.34110. The EMA of 10 is moving with bearish bias in the descendant channel and it is above the EMA of 200 and below the EMA of 100. The RSI is moving below the 50 level, the Stochastic is showing upward momentum and MACD line is below the signal line in the negative territory. The ADX is not showing any clear signals.
The indicators are showing mixed signals however, the price is moving in lower Bollinger band therefore it will grow to 1.35.
https://fxglory.com/gbpusd-analysis-for-13-12-2017/


EURUSD analysis for 13.12.2017
The FOMC rate announcement and statement will bring some volatility to EURUSD which has been moving slowly.
The support rests at 1.17230 with resistance at 1.17730 which both lines are below the weekly pivot point at 1.17920. The EMA of 10 is moving with bearish bias in the descendant channel and it is above the EMA of 200 and below the EMA of 100. The RSI falling towards the oversold area, the Stochastic is showing upward momentum and the MACD line is below the signal line in the negative territory. The ADX is not showing any clear signals.
If the price breaks the 1.18 level, it will grow towards 1.20 area, otherwise, it will continue its bearish trend towards 1.15.
https://fxglory.com/eurusd-analysis-for-13-12-2017/


USDJPY analysis for 12.12.2017
Japan has published the Tertiary Industry Activity m/m and PPI y/y and the US will release Federal Budget Balance, 30-y Bond Auction, Core PPI m/m, PPI m/m and NFIB Small Business Index.
The support rests at 113.300 with resistance at 113.540 which both lines are above the weekly pivot point at 113.010. The EMA of 10 is moving with bullish bias in the ascendant channel and it is above the EMA of 200 and the EMA of 100. The RSI is falling towards the 50 level, the Stochastic is showing upward momentum and the MACD indicator is in positive territory. The ADX is showing buy signals.
Long positions are recommended towards the upper Bollinger band targeting 114.5.
https://fxglory.com/usdjpy-analysis-for-12-12-2017/


EURUSD analysis for 12.12.2017
EURUSD had a quiet day yesterday but today the pair will be more volatile due to PPI data from the US and the ECB President’s speech.
The support rests at 1.17550 with resistance at 1.17880 which both lines are below the monthly pivot point at 1.18060. The EMA of 10 is moving with bearish bias in the descendant channel and it is below the EMA of 200 and the EMA of 100. The RSI is rising towards the 50 level, the Stochastic is moving in low ranges and the MACD indicator is in negative territory. The ADX is showing buy signals. The price is moving in lower Bollinger band.
EURUSD is covering the loss and it is growing towards 1.187.
https://fxglory.com/eurusd-analysis-for-12-12-2017/


AUDUSD analysis for 12.12.2017
NAB Business Confidence, Westpac Consumer Confidence Index and Westpac Consumer Confidence Change from Australia and Monthly Budget Statement and API Crude Oil Stock Change from the US are the most influential reports for AUDUSD.
The support rests in 0.75190 with resistance at 0.75670 which the weekly pivot point at 0.75540 is located in between the lines. The EMA of 10 is moving with bullish bias in the descendant channel and it is located below the EMA of 100 and the EMA of 200. The RSI is moving on the 50 level, the MACD indicator is in negative territory and the Stochastic is showing upward momentum. The ADX is showing buy signals. The price is in the Ichimoku Cloud and above the Chinkou Span. The Tenkan-sen is showing an upward trend while the Kijun-sen is showing a downward trend.
The indicators are showing mixed signals. The resistance area seems to be too strong to be broken therefore the price may rise near it but it will fall towards 0.725.
https://fxglory.com/audusd-analysis-for-12-12-2017/


Monday, December 11, 2017
NZDUSD analysis for 11.12.2017
Recently NZDUSD has been very volatile.
The support rests at 0.68670 with resistance at 0.69490 which both lines are above the weekly pivot point at 0.68580. The EMA of 10 is moving with bullish bias in the ascendant channel but it is below the EMA of 200 and the EMA of 100. The RSI is rising towards the overbought area, the MACD line is above the signal line in the positive territory and the Stochastic is showing upward momentum. The ADX is showing buy signal. The price is above the Ichimoku Cloud and the Chinkou Span. The Tenkan-sen and the Kijun-sen are both showing an upward trend.
Long positions are recommended towards the resistance area but after reaching this point, sellers can enjoy the market.
https://fxglory.com/nzdusd-analysis-for-11-12-2017/


GBPUSD analysis for 11.12.2017
GBP has been under pressure due to the Brexit issue however, the pressure will be removed once the final result is being announced. USD was also empowered by the strong NFP data.
The support rests at 1.33790 with resistance at 1.34800 which the weekly pivot point at 1.34110 is located in between the lines. The EMA of 10 is moving with bullish bias in the ascendant channel and it is above the EMA of 200 and the EMA of 100. The RSI is moving below the 50 level, the Stochastic is moving in low ranges and MACD line is below the signal line in the negative territory. The ADX is not showing any clear signals.
It seems that GBPUSD will continue its bullish trend towards 1.3541.
https://fxglory.com/gbpusd-analysis-for-11-12-2017/


EURUSD analysis for 11.12.2017
USD has been supported by the strong US economic data.
The support rests at 1.17650 with resistance at 1.17950 which both lines are below the monthly pivot point at 1.18401. The EMA of 10 is moving with bearish bias in the descendant channel and it is above the EMA of 200 and below the EMA of 100. The RSI rising towards the 50 level, the Stochastic is moving in high ranges and the MACD line is above the signal line in the positive territory. The ADX is showing buy signal.
The price is growing towards the upper Bollinger band targeting 1.185
https://fxglory.com/eurusd-analysis-for-11-12-2017/


Friday, December 8, 2017
USDJPY analysis for 08.12.2017
Japan has released the Economy Watchers Sentiment, Average Cash Earnings y/y, Final GDP Price Index y/y and Final GDP q/q data and the US will publish Final Wholesale Inventories m/m, Prelim UoM Consumer Sentiment, Unemployment Rate, Non-Farm Employment Change and Average Hourly Earnings m/m.
The support rests at 113.230 with resistance at 113.540 which both lines are above the weekly pivot point at 111.960. The EMA of 10 is moving with bullish bias in the ascendant channel and it is below the EMA of 200 and above the EMA of 100. The RSI is moving above the overbought area, the Stochastic is moving in high ranges and the MACD line is above the signal line in the positive territory. The ADX is showing buy signals.
Long positions are recommended towards 114.5.
https://fxglory.com/usdjpy-analysis-for-08-12-2017/


USDCAD analysis for 08.12.2017
While Canadians are dealing with the Greater Toronto Area, USD is being empowered by the economic data and the oil price.
The pair is finding support at 1.28480 with resistance at 1.28860 which both lines are above the weekly pivot point at 1.27540. The EMA of 10 is moving with bullish bias in the ascendant channel and it is located above the EMA of 200 and the EMA of 100. The RSI is moving in overbought area, the MACD line is above the signal line in the positive territory and the Stochastic is showing upward momentum. The ADX is showing buy signals. The price is above the Ichimoku Cloud and the Chinkou Span. The Tenkan-sen is showing an upward trend while the Kijun-sen is showing a horizontal trend.
Long positions are recommended towards 1.29 and then sellers can enter the market.
https://fxglory.com/usdcad-analysis-for-08-12-2017/


EURUSD analysis for 08.12.2017
Just when EUR wanted to gain momentum due to Brexit talks, the US economic reports supported USD.
The support rests at 1.17140 with resistance at 1.17730 which both lines are below the weekly pivot point at 1.18890. The EMA of 10 is moving with bearish bias in the descendant channel and it is above the EMA of 200 and below the EMA of 100. The RSI is moving in oversold area, the Stochastic is moving in low ranges and the MACD line is below the signal line in the negative territory. The ADX is showing sell signal.
The pair is oversold and the chart has created a double top pattern. EURUSD can fall towards 1.170 area and then start its correction pattern towards 1.20.
https://fxglory.com/eurusd-analysis-for-08-12-2017/


Thursday, December 7, 2017
USDCHF analysis for 07.12.2017
Switzerland is publishing Unemployment Rate and Foreign Exchange Reserves and the US will release EIA Natural Gas Stocks Change.
The support rests at 0.98860 with resistance at 0.99420 which both lines are above the weekly pivot point at 0.97890. The EMA of 10 is moving with bullish bias in the ascendant channel but it is located below the EMA of 200 and above the EMA of 100. The RSI is rising towards the overbought area, the MACD line is above the signal line in the positive territory and the Stochastic is moving in high ranges. The ADX is showing buy signal. The price is above the Ichimoku Cloud and above the Chinkou Span. The Tenkan-sen and the Kijun-sen are both showing an upward trend.
Long positions are recommended towards 0.999.
https://fxglory.com/usdchf-analysis-for-07-12-2017/


GBPUSD analysis for 07.12.2017
GBPUSD is under pressure due to the Breixt issue, and today there are no major economic reports in the UK therefore it is most likely that this currency remain under pressure.
The support rests at 1.33500 with resistance at 1.33940 which both lines are below the weekly pivot point at 1.34120. The EMA of 10 is moving with bearish bias in the descendant channel and it is above the EMA of 200 and the EMA of 100. The RSI is rising towards the 50 level, the Stochastic is moving in low ranges and MACD line is below the signal line in the negative territory. The ADX is showing sell signals.
Short positions are recommended towards the 61.8 level of Fibonacci.
https://fxglory.com/gbpusd-analysis-for-07-12-2017/


EURUSD analysis for 07.12.2017
As a result of Brexit deal, USD is gaining momentum leading EURUSD towards bearish movement.
The support rests at 1.17770 with resistance at 1.18210 which both lines are below the weekly pivot point at 1.18890. The EMA of 10 is moving with bearish bias in the descendant channel and it is above the EMA of 200 and below the EMA of 100. The RSI is moving in oversold area, the Stochastic is moving in low ranges and the MACD line is below the signal line in the negative territory. The ADX is showing sell signal.
The price is moving in lower Bollinger band and it might start its correction pattern at any time; meanwhile, short positions are recommended towards 1.17.
https://fxglory.com/eurusd-analysis-for-07-12-2017/


Wednesday, December 6, 2017
USDJPY analysis for 06.12.2017
There are no major economic reports in Japan today but the US will publish Crude Oil Inventories, Revised Unit Labor Costs q/q, Revised Nonfarm Productivity q/q and ADP Non-Farm Employment Change.
The support rests at 111.810 with resistance at 112.590 which the weekly pivot point at 111.960 is located in between the lines. The EMA of 10 is moving with bearish bias in the ascendant channel and it is below the EMA of 200 and above the EMA of 100. The RSI is rising towards the 50 level, the Stochastic is showing downward momentum and the MACD line is below the signal line in the negative territory. The ADX is showing sell signals.
Indicators are showing mixed signals. The price may decline towards the 61.8 level of Fibonacci and later start its growth towards 113.
https://fxglory.com/usdjpy-analysis-for-06-12-2017/


EURUSD analysis for 06.12.2017
EUR and USD are both acting weak and today there is the ECB Non-Monetary Policy Meeting in Eurozone and the US will release ADP employment report.
The support rests at 1.18080 with resistance at 1.18600 which both lines are below the weekly pivot point at 1.18890. The EMA of 10 is moving with bearish bias in the descendant channel and it is above the EMA of 200 and the EMA of 100. The RSI is falling towards the oversold area, the Stochastic is showing upward momentum and the MACD line is below the signal line in the negative territory. The ADX is showing weak sell signals.
Short positions are recommended towards 1.1725.
https://fxglory.com/eurusd-analysis-for-06-12-2017/


AUDUSD analysis for 06.12.2017
Australia has published GDP Growth Rate QoQ and YoY and the US will release ADP Employment Change and EIA Crude Oil Stocks Change.
The support rests at 0.75660 with resistance at 0.76000 which both lines are below the monthly pivot point at 0.76090. The EMA of 10 is moving with bearish bias along the descendant channel but it is above the EMA of 100 and below the EMA of 200. The RSI is rising towards the 50 level, the MACD line is below the signal line in the negative territory and the Stochastic is showing downward momentum. The ADX is showing sell signal. The price is below the Ichimoku Cloud and above the Chinkou Span. The Tenkan-sen and the Kijun-sen are both showing a horizontal trend.
The resistance line is too strong to be broken therefore short positions are recommended towards 0.75.
https://fxglory.com/audusd-analysis-for-06-12-2017/


Tuesday, December 5, 2017
Gold analysis for 05.12.2017
Gold had a sharp fall on Monday and it might even go lower as the USD receives a bit of support.
The support rests at 1273.40 with resistance at 1278.80 which both lines are below the weekly pivot point at 1286.27. The EMA of 10 is moving with bearish bias in the descendant channel and it is below the EMA of 200 and the EMA of 100. The RSI is moving below the 50 level, the Stochastic is showing downward momentum and the MACD line is above the signal line in the positive territory. The ADX is showing sell signals. The price is below the Ichimoku Cloud and the Chinkou Span. The Tenkan-sen is showing a downward trend while the Kijun-sen is showing a horizontal trend.
Short positions are recommended towards 1270.
https://fxglory.com/gold-analysis-for-05-12-2017/


GBPUSD analysis for 05.12.2017
The Brexit talks have failed to progress which puts GBP under pressure while USD is also dealing with its own loss of momentum.
The support rests at 1.33500 with resistance at 1.34760 which the weekly pivot point at 1.34120 is located in between the lines. The EMA of 10 is moving with bearish bias in the ascendant channel and it is above the EMA of 200 and the EMA of 100. The RSI is falling towards the oversold area, the Stochastic is showing downward momentum and MACD line is below the signal line in the negative territory. The ADX is showing sell signals.
1.333 will be the floor for this market therefore sellers can keep their positions until then and later buyers can target 1.36.
https://fxglory.com/gbpusd-analysis-for-05-12-2017/


EURUSD analysis for 05.12.2017
While USD is under pressure because of the tax reform plan, ISM Non-Manufacturing PMI will be released today which might support this currency against EUR.
The support rests at 1.18360 with resistance at 1.18790 which both lines are below the weekly pivot point at 1.18890. The EMA of 10 is moving with bearish bias in the ascendant channel and it is above the EMA of 200 and the EMA of 100. The RSI is moving below the 50 level, the Stochastic is showing upward momentum and the MACD line is below the signal line in the negative territory. The ADX is showing weak sell signals.
Indicators are showing mixed signals. The resistance level breakout will push the price towards the upper Bollinger band; otherwise, it will drop to 1.15.
https://fxglory.com/eurusd-analysis-for-05-12-2017/


Friday, December 1, 2017
USDCAD analysis for 01.12.2017
CAD has been losing momentum due to the weak oil price, on the other hand, USD might gain momentum as a result of tax reform plan bill.
The pair is finding support at 1.28490 with resistance at 1.28870 which both lines are above the weekly pivot point at 1.27360. The EMA of 10 is moving with bullish bias in the ascendant channel and it is located above the EMA of 200 and the EMA of 100. The RSI is falling towards the 50 level, the MACD line is below the signal line in the negative territory and the Stochastic is showing downward momentum. The ADX is showing sell signals. The price is above the Ichimoku Cloud and below the Chinkou Span. The Tenkan-sen is showing an upward trend while the Kijun-sen is showing a horizontal trend.
Short positions are recommended towards 1.25.
https://fxglory.com/usdcad-analysis-for-01-12-2017/


GBPUSD analysis for 01.12.2017
Brexit talks are still in progress and GBP is acting strong at the moment. Today the UK will release the manufacturing PMI data which will probably support GBP too.
The support rests at 1.34920 with resistance at 1.35460 which both lines are above the weekly pivot point at 1.32910. The EMA of 10 is moving with bullish bias along the ascendant channel and it is above the EMA of 200 and the EMA of 100. The RSI is moving in overbought area, the Stochastic is showing upward momentum and MACD line is above the signal line in the positive territory. The ADX is showing buy signals.
Long positions are recommended towards the upper Bollinger band targeting 1.365.
https://fxglory.com/gbpusd-analysis-for-01-12-2017/


EURUSD analysis for 01.12.2017
Currently USD is under pressure due to the tax reform plan bill. Once it passes through, USD will gain momentum right away.
The support rests at 1.18900 with resistance at 1.19480 which both lines are above the weekly pivot point at 1.18600. The EMA of 10 is moving with bullish bias in the ascendant channel and it is above the EMA of 200 and the EMA of 100. The RSI is moving in overbought area, the Stochastic is showing upward momentum and the MACD line is above the signal line in the positive territory. The ADX is showing buy signals.
EUR bulls will control the chart targeting 1.20.
https://fxglory.com/eurusd-analysis-for-01-12-2017/


Subscribe to:
Posts (Atom)