
Thursday, March 2, 2017
USDJPY analysis for 02.03.2017
The Fed’s representatives supported USD and on the other hand strong Chinese manufacturing PMI put JPY under pressure.
The support rests at 113.640 with resistance at 114.280 which both lines are above the weekly pivot point at 112.600. The EMA of 10 is moving with bullish bias along the ascendant channel and it is above the EMA of 100 and the EMA of 200. The RSI is moving in overbought area, the Stochastic is showing upward momentum and the MACD indicator is in positive territory. The ADX is showing buy signals.
USDJPY is growing up within Andrews’ pitchfork so long positions are recommended targeting 115 level.
https://fxglory.com/usdjpy-analysis-for-02-03-2017/

EURUSD analysis for 02.03.2017
While Trump’s speech left a negative impact on USD, Fed representatives saved this currency from losing momentum.
The support rests at 1.05210 with resistance at 1.05370 which both lines are below the weekly pivot point at 1.05610. The EMA of 10 is moving with bearish bias along the descendant channel and it is below the EMA of 100 and 200. The RSI is moving horizontally below the 50 level, the Stochastic is moving in low ranges and the MACD indicator is in negative territory. The ADX is not showing any clear signals.
Short positions are recommended targeting 1.045 area.
https://fxglory.com/eurusd-analysis-for-02-03-2017/


AUDUSD analysis for 02.03.2017
AUD was supported by Australian upbeat GDP and Solid China PMI data.
The support rests in 0.76390 with resistance at 0.76750 which both lines are below the weekly pivot point at 0.76860. The EMA of 10 is moving with bearish bias along the descendant channel but it is located above the EMA of 100 and the EMA of 200. The RSI is rising towards the 50 level, the MACD indicator is in negative territory and the Stochastic is showing downward momentum. The ADX is not showing any clear signals. The price is below the Ichimoku Cloud and above the Chinkou Span. The Tenkan-sen and the Kijun-sen are both showing a horizontal trend.
The 0.7650 breakthrough will be a good sign for sellers to target further decline to 0.76.
https://fxglory.com/audusd-analysis-for-02-03-2017/


Wednesday, March 1, 2017
USDCAD analysis for 01.03.2017
Oil price has declined and the US dollar grew against the commodity currencies.
The pair is finding support at 1.32680 with resistance at 1.33460 which both lines are above the weekly pivot point at 1.31150. The EMA of 10 is climbing up the ascendant channel and it is above the EMA of 100 and the EMA of 200. The RSI is moving in overbought area, the MACD indicator is in positive territory and the Stochastic is moving in its high ranges. The ADX is showing strong buy signals. The price is above the Ichimoku Cloud and the Chinkou Span. The Tenkan-sen is showing an upward trend while the Kijun-sen is showing a horizontal trend. The pair is not going to cross the Andrews’ pitchfork and the resistance area; pullbacks will start soon targeting 1.3120.
https://fxglory.com/usdcad-analysis-for-01-03-2017/


EURUSD analysis for 01.03.2017
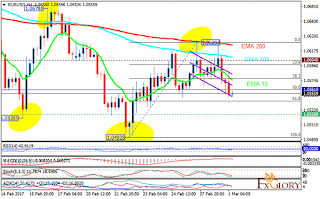
EURUSD is under the influence of economic reports in Euro zone such as: French consumer prices, the inflation rate in Italy, the Germany unemployment rate and the Germany manufacturing PMI.
The support rests at 1.05260 with resistance at 1.06040 which the weekly pivot point at 1.05610 is located in between the lines. The EMA of 10 is moving with bearish bias and it is below the EMA of 100 and 200. The RSI is moving horizontally below the 50 level, the Stochastic is moving in low ranges and the MACD indicator is in neutral territory. The ADX is not showing any clear signals.
The pair has almost reached the 61.8 level of Fibonacci retracement therefore it will start its correction pattern targeting 1.0630.
https://fxglory.com/eurusd-analysis-for-01-03-2017/

GBPUSD analysis for 01.03.2017
There have been no important economic reports to influence GBPUSD and now traders are considering UK Manufacturing PMI and Trump’s speech to Congress.
The support rests at 1.23370 with resistance at 1.24210 which both lines are below the weekly pivot point at 1.24750. The EMA of 10 is moving with bearish bias along the descendant channel and it is below the EMA of 200 and the EMA of 100. The RSI is moving in oversold area, the Stochastic is moving in low ranges and the MACD indicator is in negative territory. The ADX is not showing any clear signals.
The support area seems to be strong to be broken therefore GBPUSD must be starting its correction pattern soon targeting 1.2567.
https://fxglory.com/gbpusd-analysis-for-01-03-2017/


Subscribe to:
Posts (Atom)