
Friday, June 16, 2017
USDJPY analysis for 16.06.2017
JPY has been empowered by the BOJ’s monetary policy statement and interest rate decision.
The support rests at 110.880 with resistance at 111.440 which both lines are above the weekly pivot point at 110.080. The EMA of 10 is moving with bullish bias along the ascendant channel but it is below the EMA of 100 and above the EMA of 200. The RSI is moving in overbought area, the Stochastic is moving in high ranges and the MACD indicator is in neutral territory. The ADX is showing buy signals.
Long positions are recommended targeting 112.
https://fxglory.com/usdjpy-analysis-for-16-06-2017/

EURUSD analysis for 16.06.2017
There are no important economic reports in Eurozone but the US is publishing building permits data. EURUSD is not going to be volatile today.
The support rests at 1.11330 with resistance at 1.11610 which both lines are below the weekly pivot point at 1.12150. The EMA of 10 is moving with bearish bias along the descendant channel and it is above the EMA of 200 and below the EMA of 100. The RSI is rising towards the 50 level, the Stochastic is showing upward momentum and the MACD indicator is in negative territory. The ADX is showing sell signals.
It seems that EURUSD has already started its correction pattern targeting 61.8 level of Fibonacci at 1.123.
https://fxglory.com/eurusd-analysis-for-16-06-2017/


AUDUSD analysis for 16.06.2017
Being under the influence of the gold market, AUD seems to be acting strong.
The support rests at 0.75770 with resistance at 0.76060 which both lines are above the weekly pivot point at 0.75040. The EMA of 10 is moving with bullish bias along the ascendant channel and it is located above the EMA of 200 and above the EMA of 100. The RSI is moving horizontally on the 50 level, the MACD indicator is in positive territory and the Stochastic is showing upward momentum. The ADX is not showing any clear signals. The price is above the Ichimoku Cloud and the Chinkou Span. The Tenkan-sen is showing a downward trend while the Kijun-sen is showing a horizontal trend.
Long positions are recommended targeting 0.7750.
https://fxglory.com/audusd-analysis-for-16-06-2017/


Thursday, June 15, 2017
USDCAD analysis for 15.06.2017
USD and CAD are both getting weak and the oil price is not supporting CAD.
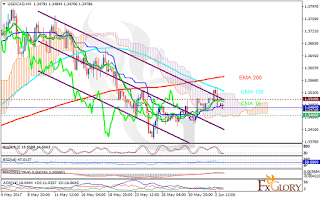
The pair is finding support at 1.32100 with resistance at 1.32720 which both lines are below the weekly pivot point at 1.34730. The EMA of 10 is moving with bearish along the descendant channel and it is located below the EMA of 200 and the EMA of 100. The RSI is rising towards the 50 level, the MACD indicator is in negative territory and the Stochastic is showing upward momentum. The ADX is showing sell signals. The price is below the Ichimoku Cloud and above the Chinkou Span. The Tenkan-sen is showing a horizontal trend while the Kijun-sen is showing a downward trend.
1.32 level of support seems to be strong therefore long positions are recommended targeting 1.33 area.
https://fxglory.com/usdcad-analysis-for-15-06-2017/


GBPUSD analysis for 15.06.2017
The UK is publishing Retail sales data and the monetary policy summary from the MPC along with the US releasing Industrial Production MoM and Export Prices MoM.
The support rests at 1.27200 with resistance at 1.27650 which both lines are below the weekly pivot point at 1.27830. The EMA of 10 is moving with bullish bias along the ascendant channel and it is below the EMA of 200 and the EMA of 100. The RSI is falling towards the oversold area, the Stochastic is showing downward momentum and MACD indicator is in negative territory. The ADX is not showing any clear signals.
Short positions are recommended targeting 1.2650.
https://fxglory.com/gbpusd-analysis-for-15-06-2017/


EURUSD analysis for 15.06.2017
EURUSD is under the influence of some economic reports such as French 10-y Bond Auction, Trade Balance, and French Final CPI m/m in Eurozone and Natural Gas Storage, NAHB Housing Market Index, Import Prices m/m and Unemployment Claims in the US.
The support rests at 1.12020 with resistance at 1.12340 which the weekly pivot point at 1.12150 is located in between the lines. The EMA of 10 is moving with bullish bias along the ascendant channel and it is above the EMA of 200 and below the EMA of 100. The RSI is moving horizontally on the 50 level, the Stochastic is showing downward momentum and the MACD indicator is in neutral territory. The ADX is not showing any clear signals.
EURUSD seems to be volatile today; the 1.13 level seems to be too strong to be broken therefore short positions are recommended for short term traders targeting 1.11.
https://fxglory.com/eurusd-analysis-for-15-06-2017/


Wednesday, June 14, 2017
USDJPY analysis for 14.06.2017
Japan is releasing the Revised Industrial Production m/m data along with the US publishing Federal Funds Rate, FOMC Statement, Crude Oil Inventories, Business Inventories m/m, Core Retail Sales m/m and CPI m/m therefore USDJPY will be chiefly under the influence of the economic reports in the US.
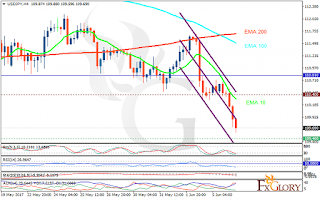
The support rests at 109.890 with resistance at 110.210 which the weekly pivot point at 110.080 is located in between the lines. The EMA of 10 is moving with bearish bias along the descendant channel and it is below the EMA of 100 and above the EMA of 200. The RSI is moving on the 50 level, the Stochastic is moving in middle ranges and the MACD indicator is in neutral territory. The ADX is not showing any clear signals.
Short positions are recommended targeting 108.
https://fxglory.com/usdjpy-analysis-for-14-06-2017/


Gold analysis for 14.06.2017
FED announcement regarding the rate hike will influence gold; besides, the US is publishing U.S. Consumer Inflation data, Retail Sales Data and Business Inventories which leads to Gold volatility.
The support rests at 1266.56 with resistance at 1272.24 which both lines are below the weekly pivot point at 78.97. The EMA of 10 is moving horizontally and it is above the EMA of 200 and below the EMA of 100. The RSI is moving horizontally on the 50 level, the Stochastic is showing upward momentum and the MACD indicator is in negative territory. The ADX is not showing any clear signals. The price is below the Ichimoku Cloud and the Chinkou Span. The Tenkan-sen and the Kijun-sen are both showing a horizontal trend.
The chart seems bullish but it is not going beyond 1290 area.
https://fxglory.com/gold-analysis-for-14-06-2017/


EURUSD analysis for 14.06.2017
FOMC announcement is the most influential event for EURUSD along with the US publishing CPI and Retail Sales data.
The support rests at 1.12070 with resistance at 1.12270 which the weekly pivot point at 1.12150 is located in between the lines. The EMA of 10 is moving with bullish bias and it is above the EMA of 200 and below the EMA of 100. The RSI is moving horizontally on the 50 level, the Stochastic is showing upward momentum and the MACD indicator is in negative territory. The ADX is showing buy signals.
EURUSD is rising towards the 61.8 level of Fibonacci, smoothing the way for further growth targeting 1.15.
https://fxglory.com/eurusd-analysis-for-14-06-2017/


Tuesday, June 13, 2017
USDCAD analysis for 13.06.2017
CAD is acting weak versus its American counterpart due to the weak oil prices and BOC decision regarding the rate cuts.
The pair is finding support at 1.32620 with resistance at 1.33100 which both lines are below the weekly pivot point at 1.34730. The EMA of 10 is moving with bearish along the descendant channel and it is located below the EMA of 200 and below the EMA of 100. The RSI is moving horizontally in oversold area, the MACD indicator is in negative territory and the Stochastic is showing downward momentum. The ADX is showing sell signals. The price is below the Ichimoku Cloud and the Chinkou Span. The Tenkan-sen and the Kijun-sen are both showing a horizontal trend.
The 1.32 level of support seems to be too strong to be broken also, CAD is not powerful enough to create the correction pattern. Traders can go long at the moment.
https://fxglory.com/usdcad-analysis-for-13-06-2017/


GBPUSD analysis for 13.06.2017
The UK election put pressure on GBPUSD and still this pair is acting weak.
The support rests at 1.26440 with resistance at 1.26880 which both lines are below the weekly pivot point at 1.27830. The EMA of 10 is moving with bearish bias along the descendant channel and it is below the EMA of 200 and the EMA of 100. The RSI is moving horizontally in oversold area, the Stochastic is showing upward momentum and MACD indicator is in negative territory. The ADX is showing sell signals.
Despite the pair’s attempt to create a bullish candle, GBPUSD will continue its downward trend targeting 1.25.
https://fxglory.com/gbpusd-analysis-for-13-06-2017/


EURUSD analysis for 13.06.2017
EURUSD is under the influence of some economic reports such as ZEW Economic Sentiment, German WPI m/m, and French Final Non-Farm Payrolls q/q in Eurozone and 30-y Bond Auction, Core PPI m/m, PPI m/m, and NFIB Small Business Index in the US.
The support rests at 1.11830 with resistance at 1.12030 which both lines are below the weekly pivot point at 1.12150. The EMA of 10 is moving horizontally and it is above the EMA of 200 and below the EMA of 100. The RSI is falling towards the oversold area, the Stochastic is showing downward momentum and the MACD indicator is in negative territory. The ADX is showing sell signals.
EURUSD is falling down towards the 1.108 area however, 1.10 level seems to be a strong support area therefore long positions are recommended for long term traders.
https://fxglory.com/eurusd-analysis-for-13-06-2017/


Monday, June 12, 2017
USDJPY analysis for 12.06.2017
USDJPY is under the influence of some economic data such as Machinery Orders MoM in Japan and Monthly Budget Statement in the US.
The support rests at 110.020 with resistance at 110.410 which the weekly pivot point at 110.080 is located in between the lines. The EMA of 10 is moving with bullish bias but it is below the EMA of 100 and above the EMA of 200. The RSI is moving on the 50 level, the Stochastic is moving in low ranges and the MACD indicator is in neutral territory. The ADX is not showing any clear signals.
Currently the price is falling down towards the 110 area however, the 110.5 level breakout will be a good sign for buyers since the pair will continue its bullish trend.
https://fxglory.com/usdjpy-analysis-for-12-06-2017/


NZDUSD analysis for 12.06.2017
Last week NZD had been supported by GDT Price data and Manufacturing Sales.
The support rests at 0.71670 with resistance at 0.72190 which the weekly pivot point at 0.71820 is located in between the lines. The EMA of 10 is moving with bullish bias along the ascendant channel and it is above the EMA of 100 and 200. The RSI is falling towards the 50 level, the MACD indicator is in positive territory and the Stochastic is showing downward momentum. The ADX is showing sell signals. The price is in the Ichimoku Cloud and below the Chinkou Span. The Tenkan-sen is showing a downward trend while the Kijun-sen is showing a horizontal trend. While considering the short term pullbacks, the pair seems to be growing up in long term trading targeting 0.73.
https://fxglory.com/nzdusd-analysis-for-12-06-2017/


EURUSD analysis for 12.06.2017
The UK election put pressure on EURUSD. Today there are no important economic reports in Eurozone or the US.
The support rests at 1.11980 with resistance at 1.12260 which the weekly pivot point at 1.12150 is located in between the lines. The EMA of 10 is moving with bearish bias and it is above the EMA of 200 and below the EMA of 100. The RSI is moving horizontally below the 50 level, the Stochastic is showing upward momentum and the MACD indicator is in negative territory. The ADX is showing buy signals.
Since EURUSD has already started its correction pattern, long positions are recommended targeting 1.13.
https://fxglory.com/eurusd-analysis-for-12-06-2017/


Friday, June 9, 2017
GBPUSD analysis for 09.06.2017
Apart from the UK general election, GBPUSD is still under the influence of Brexit issue.
The support rests at 1.26900 with resistance at 1.27990 which both lines are below the weekly pivot point at 1.28590. The EMA of 10 is moving with bearish bias along the descendant channel and it is below the EMA of 200 and the EMA of 100. The RSI is moving horizontally in oversold area, the Stochastic is moving in low ranges and MACD indicator is in neutral territory. The ADX is showing sell signals.
GBPUSD had a sudden drop towards the support area however, the correction pattern will start soon targeting 1.28 area.
https://fxglory.com/gbpusd-analysis-for-09-06-2017/


EURUSD analysis for 09.06.2017
EURUSD is under the influence of some economic data such as Italian Quarterly Unemployment Rate, French Industrial Production m/m, French Gov Budget Balance, German Trade Balance, and German Final CPI m/m in Eurozone and Final Wholesale Inventories m/m in the US.
The support rests at 1.11650 with resistance at 1.12330 which the weekly pivot point at 1.12240 is located in between the lines. The EMA of 10 is moving with bearish bias along the descendant channel and it is above the EMA of 100 and the EMA of 200. The RSI is falling towards the oversold area, the Stochastic is showing downward momentum and the MACD indicator is in neutral territory. The ADX is not showing any clear signals.
The support level breakthrough will push the pair downwards targeting 1.10.
https://fxglory.com/eurusd-analysis-for-09-06-2017/


AUDUSD analysis for 09.06.2017
The Australian banks are considering slowing down the investor loans.
The support rests at 0.75220 with resistance at 0.75550 which both lines are above the weekly pivot point at 0.74290. The EMA of 10 is moving with bullish bias along the ascendant channel and it is located above the EMA of 200 and above the EMA of 100. The RSI is moving above the 50 level, the MACD indicator is in positive territory and the Stochastic is showing downward momentum. The ADX is showing sell signals. The price is above the Ichimoku Cloud and the Chinkou Span. The Tenkan-sen is showing a downward trend while the Kijun-sen is showing a horizontal trend.
Despite the indicators sell signals, long positions are recommended targeting 0.7560.
https://fxglory.com/audusd-analysis-for-09-06-2017/


Thursday, June 8, 2017
USDJPY analysis for 08.06.2017
USDJPY will be under the influence of some economic reports such as the Economy Watchers Sentiment, Final GDP Price Index y/y, Current Account and Bank Lending y/y in Japan and the US is publishing Natural Gas Storage and Unemployment Claims.
The support rests at 109.400 with resistance at 110.100 which both lines are below the weekly pivot point at 110.810. The EMA of 10 is moving with bullish bias but it is below the EMA of 100 and above the EMA of 200. The RSI is rising towards the 50 level, the Stochastic is moving in high ranges and the MACD indicator is in negative territory. The ADX is showing sell signals.
The support level breakthrough will push the pair downwards targeting 102 otherwise if the resistance area is broken, further growth will be expected.
https://fxglory.com/usdjpy-analysis-for-08-06-2017/


Gold analysis for 08.06.2017
Gold has been growing since the first days of May and it has reached 1295.82.
The support rests at 1282.75 with resistance at 1291.72 which both lines are above the weekly pivot point at 1274.57. The EMA of 10 is moving with bearish bias and it is above the EMA of 200 and the EMA of 100. The RSI is falling towards the 50 level, the Stochastic is showing upward momentum and the MACD indicator is in positive territory. The ADX is not showing any clear signals.
It seems that the resistance area is too strong to be broken, therefore short positions are recommended towards the 38.2 level of Fibonacci.
https://fxglory.com/gold-analysis-for-08-06-2017/


EURUSD analysis for 08.06.2017
ECB announcement along with the UK general election are the chief influential events for EURUSD.
The support rests at 1.12400 with resistance at 1.12700 which both lines are above the weekly pivot point at 1.12240. The EMA of 10 is moving horizontally along the ascendant channel and it is above the EMA of 100 and the EMA of 200. The RSI is moving horizontally on the 50 level, the Stochastic is showing upward momentum and the MACD indicator is in neutral territory. The ADX is not showing any clear signals.
Due to the high volatility of the market it is really difficult to decide what direction the trend may go however, in terms of price growth, buyers can target 1.15 area.
https://fxglory.com/eurusd-analysis-for-08-06-2017/


Wednesday, June 7, 2017
USDCAD analysis for 07.06.2017
CAD is being empowered by the oil prices and also USDCAD will be under the influence of Crude Oil Inventories announcement today.
The pair is finding support at 1.34370 with resistance at 1.34690 which both lines are below the weekly pivot point at 1.34840. The EMA of 10 is moving with bearish and it is located below the EMA of 200 and below the EMA of 100. The RSI is falling towards the oversold area, the MACD indicator is in negative territory and the Stochastic is showing upward momentum. The ADX is not showing any clear signals. The price is below the Ichimoku Cloud and the Chinkou Span. The Tenkan-sen is showing a downward trend while the Kijun-sen is showing a horizontal trend.
The trend direction is chiefly made by the Crude Oil Inventories announcement however the support level breakthrough will smooth the way for further decline targeting 1.34 otherwise the price will grow to 1.35.
https://fxglory.com/usdcad-analysis-for-07-06-2017/


GBPUSD analysis for 07.06.2017
For GBPUSD actually, there are no major economic reports however, the chart will be choppy tomorrow due to the UK general election.
The support rests at 1.28930 with resistance at 1.29170 which both lines are above the weekly pivot point at 1.28590. The EMA of 10 is moving with bullish bias along the ascendant channel and it has reached to the EMA of 200 but both are below the EMA of 100. The RSI is moving horizontally on the 50 level, the Stochastic is showing upward momentum and MACD indicator is in positive territory. The ADX is not showing any clear signals.
While considering pullbacks on the way, long positions are recommended targeting 1.3050.
https://fxglory.com/gbpusd-analysis-for-07-06-2017/


EURUSD analysis for 07.06.2017
Europe is releasing Italian Retail Sales m/m and German Factory Orders m/m along with the US publishing Consumer Credit m/m and Crude Oil Inventories.
The support rests at 1.12520 with resistance at 1.12870 which both lines are above the weekly pivot point at 1.12240. The EMA of 10 is moving with bullish bias along the ascendant channel and it is above the EMA of 100 and the EMA of 200. The RSI is falling towards the 50 level, the Stochastic is showing downward momentum and the MACD indicator is in positive territory. The ADX is not showing any clear signals.
Despite the pair’s attempt to fall, it will continue its bullish trend targeting 1.13 area.
https://fxglory.com/eurusd-analysis-for-07-06-2017/


Tuesday, June 6, 2017
USDJPY analysis for 06.06.2017
Japan is releasing the 30-y Bond Auction and Average Cash Earnings y/y data along with the US publishing IBD/TIPP Economic Optimism and JOLTS Job Openings.
The support rests at 109.460 with resistance at 110.400 which both lines are below the weekly pivot point at 110.810. The EMA of 10 is moving with bearish bias along the descendant channel and it is below the EMA of 100 and above the EMA of 200. The RSI is moving in oversold area, the Stochastic is moving in low ranges and the MACD indicator is in negative territory. The ADX is showing sell signals.
Long term traders can open buy positions targeting 111.50 while short term traders can target 109 area however the support area does not seem to be broken.
https://fxglory.com/usdjpy-analysis-for-06-06-2017/


NZDUSD analysis for 06.06.2017
While NZDUSD can be chiefly under the influence of Qatar issue, there is a bank holiday in New Zealand.
The support rests at 0.71370 with resistance at 0.71830 which both lines are above the weekly pivot point at 0.71080. The EMA of 10 is moving with bullish bias along the ascendant channel and it is above the EMA of 100 and 200. The RSI is moving horizontally in overbought area, the MACD indicator is in positive territory and the Stochastic is moving in high ranges. The ADX is showing buy signals. The price is above the Ichimoku Cloud and the Chinkou Span. The Tenkan-sen and the Kijun-sen are both showing an upward trend.
Long positions are recommended targeting 0.72.
https://fxglory.com/nzdusd-analysis-for-06-06-2017/


EURUSD analysis for 06.06.2017
Thursday is going to be volatile due to numerous important events however today the US and the Eurozone are not releasing any economic reports.
The support rests at 1.12610 with resistance at 1.12850 which both lines are above the weekly pivot point at 1.12240. The EMA of 10 is moving with bullish bias along the ascendant channel and it is above the EMA of 100 and the EMA of 200. The RSI is moving in overbought area, the Stochastic is showing upward momentum and the MACD indicator is in positive territory. The ADX is showing buy signals.
Long positions are recommended with the first target at 1.13.
https://fxglory.com/eurusd-analysis-for-06-06-2017/


USDJPY analysis for 06.06.2017
Japan is releasing the 30-y Bond Auction and Average Cash Earnings y/y data along with the US publishing IBD/TIPP Economic Optimism and JOLTS Job Openings.
The support rests at 109.460 with resistance at 110.400 which both lines are below the weekly pivot point at 110.810. The EMA of 10 is moving with bearish bias along the descendant channel and it is below the EMA of 100 and above the EMA of 200. The RSI is moving in oversold area, the Stochastic is moving in low ranges and the MACD indicator is in negative territory. The ADX is showing sell signals.
Long term traders can open buy positions targeting 111.50 while short term traders can target 109 area however the support area does not seem to be broken.
https://fxglory.com/usdjpy-analysis-for-06-06-2017/

NZDUSD analysis for 06.06.2017
While NZDUSD can be chiefly under the influence of Qatar issue, there is a bank holiday in New Zealand.
The support rests at 0.71370 with resistance at 0.71830 which both lines are above the weekly pivot point at 0.71080. The EMA of 10 is moving with bullish bias along the ascendant channel and it is above the EMA of 100 and 200. The RSI is moving horizontally in overbought area, the MACD indicator is in positive territory and the Stochastic is moving in high ranges. The ADX is showing buy signals. The price is above the Ichimoku Cloud and the Chinkou Span. The Tenkan-sen and the Kijun-sen are both showing an upward trend.
Long positions are recommended targeting 0.72.
https://fxglory.com/nzdusd-analysis-for-06-06-2017/


EURUSD analysis for 06.06.2017
Thursday is going to be volatile due to numerous important events however today the US and the Eurozone are not releasing any economic reports.
The support rests at 1.12610 with resistance at 1.12850 which both lines are above the weekly pivot point at 1.12240. The EMA of 10 is moving with bullish bias along the ascendant channel and it is above the EMA of 100 and the EMA of 200. The RSI is moving in overbought area, the Stochastic is showing upward momentum and the MACD indicator is in positive territory. The ADX is showing buy signals.
Long positions are recommended with the first target at 1.13.
https://fxglory.com/eurusd-analysis-for-06-06-2017/


Monday, June 5, 2017
USDCAD analysis for 05.06.2017
CAD has been under pressure due to the Oil price and the US is publishing manufacturing PMI data.
The pair is finding support at 1.34600 with resistance at 1.35100 which the weekly pivot point at 1.34840 is located in between the lines. The EMA of 10 is moving with bearish along the descendant channel and it is located below the EMA of 200 and below the EMA of 100. The RSI is falling towards the oversold area, the MACD indicator is in neutral territory and the Stochastic is showing downward momentum. The ADX is showing sell signals. The price is in the Ichimoku Cloud and below the Chinkou Span. The Tenkan-sen and the Kijun-sen are both showing a horizontal momentum.
Short positions are recommended targeting 1.340 area.
https://fxglory.com/usdcad-analysis-for-05-06-2017/

GBPUSD analysis for 05.06.2017
GBP is under pressure due to the recent attack to London also GBPUSD is under the influence of the elections in the Great Britain.
The support rests at 1.12460 with resistance at 1.12830 which both lines are above the weekly pivot point at 1.12240. The EMA of 10 is moving with bullish bias along the ascendant channel and it is below the EMA of 200 and the EMA of 100. The RSI is falling towards the 50 level, the Stochastic is showing downward momentum and MACD indicator is in positive territory. The ADX is not showing any clear signals.
The support area seems to be too strong to be broken therefore go long and target 1.2962.
https://fxglory.com/gbpusd-analysis-for-05-06-2017/


EURUSD analysis for 05.06.2017
There is a holiday in France and Germany but the US is releasing the non-manufacturing PMI data.
The support rests at 1.12460 with resistance at 1.12830 which both lines are above the weekly pivot point at 1.12240. The EMA of 10 is moving with bullish bias along the ascendant channel and it is above the EMA of 100 and the EMA of 200. The RSI is falling towards the 50 level, the Stochastic is showing downward momentum and the MACD indicator is in positive territory. The ADX is not showing any clear signals.
EURUSD is falling down at the moment getting prepared for a longterm bullish trend.
https://fxglory.com/eurusd-analysis-for-05-06-2017/


USDCAD analysis for 05.06.2017
CAD has been under pressure due to the Oil price and the US is publishing manufacturing PMI data.
The pair is finding support at 1.34600 with resistance at 1.35100 which the weekly pivot point at 1.34840 is located in between the lines. The EMA of 10 is moving with bearish along the descendant channel and it is located below the EMA of 200 and below the EMA of 100. The RSI is falling towards the oversold area, the MACD indicator is in neutral territory and the Stochastic is showing downward momentum. The ADX is showing sell signals. The price is in the Ichimoku Cloud and below the Chinkou Span. The Tenkan-sen and the Kijun-sen are both showing a horizontal momentum.
Short positions are recommended targeting 1.340 area.
https://fxglory.com/usdcad-analysis-for-05-06-2017/


GBPUSD analysis for 05.06.2017
GBP is under pressure due to the recent attack to London also GBPUSD is under the influence of the elections in the Great Britain.
The support rests at 1.12460 with resistance at 1.12830 which both lines are above the weekly pivot point at 1.12240. The EMA of 10 is moving with bullish bias along the ascendant channel and it is below the EMA of 200 and the EMA of 100. The RSI is falling towards the 50 level, the Stochastic is showing downward momentum and MACD indicator is in positive territory. The ADX is not showing any clear signals.
The support area seems to be too strong to be broken therefore go long and target 1.2962.
https://fxglory.com/gbpusd-analysis-for-05-06-2017/


EURUSD analysis for 05.06.2017
There is a holiday in France and Germany but the US is releasing the non-manufacturing PMI data.
The support rests at 1.12460 with resistance at 1.12830 which both lines are above the weekly pivot point at 1.12240. The EMA of 10 is moving with bullish bias along the ascendant channel and it is above the EMA of 100 and the EMA of 200. The RSI is falling towards the 50 level, the Stochastic is showing downward momentum and the MACD indicator is in positive territory. The ADX is not showing any clear signals.
EURUSD is falling down at the moment getting prepared for a longterm bullish trend.
https://fxglory.com/eurusd-analysis-for-05-06-2017/


Thursday, June 1, 2017
GBPUSD analysis for 01.06.2017
GBP is under pressure due to reports and the polls; the Great Britain is also publishing manufacturing PMI data.
The support rests at 1.28530 with resistance at 1.28970 which the weekly pivot point at 1.28730 is located in between the lines. The EMA of 10 is moving with bullish bias and it is above the EMA of 200 and below the EMA of 100. The RSI is moving horizontally on the 50 level, the Stochastic is showing downward momentum and the MACD indicator is in negative territory. The ADX is showing weak sell signals.
The bears are taking the control of the chart targeting 1.260.
https://fxglory.com/gbpusd-analysis-for-01-06-2017/


EURUSD analysis for 01.06.2017
The US is publishing ADP Employment Change and ADP Employment Change along with the Eurozone releasing GDP Growth Rate QoQ Final and GDP Growth Rate YoY Final.
The support rests at 1.12220 with resistance at 1.12680 which both lines are above the weekly pivot point at 1.12020. The EMA of 10 is moving with bullish bias along the ascendant channel and it is above the EMA of 100 and the EMA of 200. The RSI is falling towards the 50 level, the Stochastic is showing downward momentum and the MACD indicator is in positive territory. The ADX is showing buy signals.
The resistance area seems to be too strong to be broken therefore short positions are recommended targeting 1.100.
https://fxglory.com/eurusd-analysis-for-01-06-2017/


AUDUSD analysis for 01.06.2017
Australia is releasing Retail Sales MoM and Private Capital Expenditure QoQ along with the US publishing ADP Employment Change and ISM Manufacturing PMI therefore this pair is going to be more volatile.
The support rests in 0.73710 with resistance at 0.74410 which both lines are below the weekly pivot point at 0.74600. The EMA of 10 is moving with bearish bias along the descendant channel and it is located below the EMA of 100 and the EMA of 200. The RSI is rising towards the 50 level, the MACD indicator is in negative territory and the Stochastic is moving in low ranges. The ADX is not showing any clear signals. The price is below the Ichimoku Cloud and above the Chinkou Span. The Tenkan-sen and the Kijun-sen are both showing a downward trend.
As long as the price stays below 0.75 area, bearish trend is expected targeting 0.735.
https://fxglory.com/audusd-analysis-for-01-06-2017/


Subscribe to:
Posts (Atom)