
Thursday, October 26, 2017
USDJPY analysis for 26.10.2017
Japan is publishing SPPI y/y data, and the US will release Natural Gas Storage, Pending Home Sales m/m, Prelim Wholesale Inventories m/m and Unemployment Claims.
The support rests at 113.450 with resistance at 114.010 which both lines are above the weekly pivot point at 112.900. The EMA of 10 is moving with bullish bias in the ascendant channel and it is above the EMA of 100 and the EMA of 200. The RSI is moving horizontally on 50 level, the Stochastic is moving in low ranges and the MACD indicator is in positive territory. The ADX is not showing any clear signals.
USDJPY will continue its bullish trend towards 114.5.
https://fxglory.com/usdjpy-analysis-for-26-10-2017/

NZDUSD analysis for 26.10.2017
USD is getting strength after the Federal Reserve announcement regarding the interest rates raise.
The support rests at 0.68620 with resistance at 0.69120 which both lines are below the weekly pivot point at 0.70380. The EMA of 10 is moving with bearish bias along the descendant channel and it is below the EMA of 100 and 200. The RSI is moving in the oversold area, the MACD indicator is in negative territory and the Stochastic is moving in middle ranges. The ADX is not showing any clear signals. The price is below the Ichimoku Cloud and the Chinkou Span. The Tenkan-sen and the Kijun-sen are both showing a downward trend.
Short positions are recommended towards 0.65.
https://fxglory.com/nzdusd-analysis-for-26-10-2017/


EURUSD analysis for 26.10.2017
Today the ECB rate announcement and statement and the press conference by Draghi are the most influential events of EURUSD.
The support rests at 1.18170 with resistance at 1.18420 which both lines are above the weekly pivot point at 1.17920. The EMA of 10 is moving with bullish bias in the ascendant channel and it is below the EMA of 200 and above the EMA of 100. The RSI is moving in overbought area, the Stochastic is moving in high ranges and the MACD indicator is in positive territory. The ADX is showing buy signals.
Long positions are recommended towards 1.21.
https://fxglory.com/eurusd-analysis-for-26-10-2017/


Wednesday, October 25, 2017
USDCHF analysis for 25.10.2017
Today Switzerland will publish UBS Consumption Indicator and Economic Sentiment Index and later the US will release Durable Goods Orders MoM and New Home Sales.
The support rests at 0.98780 with resistance at 0.99180 which both lines are above the weekly pivot point at 0.98060. The EMA of 10 is moving with bullish bias along the ascendant channel and it is located above the EMA of 200 and the EMA of 100. The RSI is moving horizontally in overbought area, the MACD indicator is in positive territory and the Stochastic is moving in high ranges. The ADX is showing buy signals. The price is above the Ichimoku Cloud and below the Chinkou Span. The Tenkan-sen and the Kijun-sen are both showing an upward trend.
Long positions are recommended towards 1.0030.
https://fxglory.com/usdchf-analysis-for-25-10-2017/


GBPUSD analysis for 25.10.2017
GBP is under pressure because of the issues about Brexit and today the UK advance GDP data will have a great influence on GBPUSD.
The support rests at 1.30810 with resistance at 1.31630 which both lines are below the weekly pivot point at 1.31940. The EMA of 10 is moving with bearish bias in the descendant channel and it is below the EMA of 200 and the EMA of 100. The RSI is rising towards the 50 level, the Stochastic is moving in low ranges and the MACD indicator is in negative territory. The ADX is not showing any clear signals.
GBPUSD will be fluctuating within 1.31 and 1.32 area.
https://fxglory.com/gbpusd-analysis-for-25-10-2017/


EURUSD analysis for 25.10.2017
When the republicans show their disapproval of Trump’s tax reform program, USD wend under pressure and EURUSD managed to reach 1.179. Later again, USD was empowered when the secret vote news came out for the next Fed Chair.
The support rests at 1.17400 with resistance at 1.17760 which both lines are below the weekly pivot point at 1.17880. The EMA of 10 is moving with bearish bias in the horizontal channel and it is below the EMA of 200 and the EMA of 100. The RSI is moving below the 50 level, the Stochastic is moving in low ranges and the MACD indicator is in negative territory. The ADX is showing weak buy signals.
There is no clear direction for EURUSD at the moment. The resistance level breakout will push the price to higher levels towards 1.18, otherwise it will decline below 1.17.
https://fxglory.com/eurusd-analysis-for-25-10-2017/


Tuesday, October 24, 2017
USDJPY analysis for 24.10.2017
JPY has been supported after the election however, USD has been empowered as well due to tax issue and the probability of interest rates growth. Japan has published Nikkei Manufacturing PMI Flash and the US will release Markit Manufacturing PMI Flash and Markit Composite PMI Flash.
The support rests at 113.180 with resistance at 113.580 which both lines are above the weekly pivot point at 112.900. The EMA of 10 is moving with bearish bias in the ascendant channel but it is above the EMA of 200 and the EMA of 100. The RSI is rising towards the overbought area, the Stochastic is showing downward momentum and the MACD indicator is in positive territory. The ADX is showing weak buy signals.
Long positions are recommended towards 114.
https://fxglory.com/usdjpy-analysis-for-24-10-2017/


USDCAD analysis for 24.10.2017
USD is acting stronger against its Canadian counterpart after the Bank of Canada announcement regarding the rate hikes.
The pair is finding support at 1.26160 with resistance at 1.26650 which both lines are above the weekly pivot point at 1.25680. The EMA of 10 is moving with bullish bias in the ascendant channel and it is above the EMA of 100 and the EMA of 200. The RSI is moving in overbought area, the MACD indicator is in positive territory and the Stochastic is showing downward momentum. The ADX is showing buy signals. The price is above the Ichimoku Cloud and the Chinkou Span. The Tenkan-sen is showing an upward trend while the Kijun-sen is showing a horizontal trend.
Long positions are recommended towards 1.28.
https://fxglory.com/usdcad-analysis-for-24-10-2017/


EURUSD analysis for 24.10.2017
This week is very important for EUR because of the ECB statement and press conference. Today EURUSD is chiefly under the influence of the manufacturing and services PMI in Eurozone.
The support rests at 1.17490 with resistance at 1.17750 which both lines are below the weekly pivot point at 1.17880. The EMA of 10 is moving with bearish bias in the ascendant channel and it is below the EMA of 200 and the EMA of 100. The RSI is falling towards the oversold area, the Stochastic is moving in high ranges and the MACD indicator is in negative territory. The ADX is showing buy signals.
The indicators are showing mixed signals. If the support area remains intact, EURUSD will grow towards 61.8 level of Fibonacci at 1.181.
https://fxglory.com/eurusd-analysis-for-24-10-2017/


Monday, October 23, 2017
GBPUSD analysis for 23.10.2017
GBP has been supported by the result of Brexit negotiations which this helped GBP against the strong USD.
The support rests at 1.31650 with resistance at 1.32190 which the weekly pivot point at 1.31940 is located in between the lines. The EMA of 10 is moving with bearish bias along the descendant channel and it is below the EMA of 200 and the EMA of 100. The RSI is moving on the 50 level, the Stochastic is moving in high ranges and MACD indicator is in negative territory. The ADX is showing weak buy signals.
Short positions are recommended towards 1.3037.
https://fxglory.com/gbpusd-analysis-for-23-10-2017/


EURUSD analysis for 23.10.2017
EUR is under pressure because of the situation in Spain and today no important economic reports will be published in Eurozone or the US.
The support rests at 1.17480 with resistance at 1.17760 which both lines are below the weekly pivot point at 1.17880. The EMA of 10 is moving with bearish bias in the horizontal channel and it is below the EMA of 200 and above the EMA of 100. The RSI is moving below the 50 level, the Stochastic is showing downward momentum and the MACD indicator is in neutral territory. The ADX is showing sell signals.
The support level seems to be too strong to be broken therefore EURUSD will start its correction pattern towards 1.1850.
https://fxglory.com/eurusd-analysis-for-23-10-2017/


AUDUSD analysis for 23.10.2017
As a result of divergence in monetary policy between the Reserve Bank of Australia and the U.S. Federal Reserve, AUDUSD has been moving with bearish bias.
The support rests at 0.77950 with resistance at 0.78310 which both lines are below the weekly pivot point at 0.78370. The EMA of 10 is moving with bearish bias along the descendant channel and it is below the EMA of 200 and above the EMA of 100. The RSI is falling towards the oversold area, the MACD indicator is in neutral territory and the Stochastic is moving in low ranges. The ADX is not showing any clear signals. The price is below the Ichimoku Cloud and the Chinkou Span. The Tenkan-sen and the Kijun-sen are both showing a horizontal trend.
Short positions are recommended towards 0.7740.
https://fxglory.com/audusd-analysis-for-23-10-2017/


Friday, October 20, 2017
USDJPY analysis for 20.10.2017
There are no major economic reports in Japan or the US but it seems that the US is acting stronger than before.
The support rests at 112.810 with resistance at 113.440 which both lines are above the weekly pivot point at 112.110. The EMA of 10 is moving with bullish bias in the ascendant channel and it is above the EMA of 100 and the EMA of 200. The RSI is moving in the overbought area, the Stochastic is showing upward momentum and the MACD indicator is in positive territory. The ADX is showing buy signals.
USDJPY will continue its bullish trend towards 114.5.
https://fxglory.com/usdjpy-analysis-for-20-10-2017/


Gold analysis for 20.10.2017
Even the better than expected Treasury yields could not support USD against Gold however, gold will be under pressure due to geopolitical issues about North Korea.
The support rests at 1274.95 with resistance at 1291.95 which both lines are below the weekly pivot point at 1296.23. The EMA of 10 is moving horizontally in the descendant channel and it is below the EMA of 200 and the EMA of 100. The RSI is falling towards the oversold area, the Stochastic is showing downward momentum and the MACD indicator is in negative territory. The ADX is showing sell signals. The price is below the Ichimoku Cloud and the Chinkou Span. The Tenkan-sen and the Kijun-sen are both showing a horizontal trend.
Short positions are recommended towards 1270.
https://fxglory.com/gold-analysis-for-20-10-2017/


EURUSD analysis for 20.10.2017
USD was empowered when the decisions were made regarding the tax reform bill.
The support rests at 1.17760 with resistance at 1.18450 which the weekly pivot point at 1.18050 is located in between the lines. The EMA of 10 is moving with bullish bias in the horizontal channel and it is below the EMA of 200 and above the EMA of 100. The RSI is falling below the 50 level, the Stochastic is showing downward momentum and the MACD indicator is in neutral territory. The ADX is showing sell signals.
Short positions are recommended towards 1.170.
https://fxglory.com/eurusd-analysis-for-20-10-2017/


Wednesday, October 18, 2017
USDJPY analysis for 18.10.2017
Japan is not releasing any economic reports today but the US will release Crude Oil Inventories, Housing Starts and Building Permits.
The support rests at 112.170 with resistance at 112.670 which both lines are above the weekly pivot point at 112.110. The EMA of 10 is moving with bullish bias in the ascendant channel but it is below the EMA of 100 and above the EMA of 200. The RSI is rising towards the overbought area, the Stochastic is showing upward momentum and the MACD indicator is in negative territory. The ADX is showing weak buy signals.
Long positions are recommended towards 61.8 level of Fibonacci at 112.9.
https://fxglory.com/usdjpy-analysis-for-18-10-2017/


EURUSD analysis for 18.10.2017
EUR has been empowered by the economic reports in Eurozone and the US will publish Beige Book, Crude Oil Inventories, Housing Starts and Building Permits.
The support rests at 1.17520 with resistance at 1.17800 which both lines are below the weekly pivot point at 1.18050. The EMA of 10 is moving with bearish bias along the descendant channel and it is below the EMA of 200 and the EMA of 100. The RSI is falling towards the oversold area, the Stochastic is showing upward momentum and the MACD indicator is in negative territory. The ADX is showing sell signals.
It seems that EURUSD has started its correction pattern towards 1.19 area while noting that pullbacks can reach towards 1.173.
https://fxglory.com/eurusd-analysis-for-18-10-2017/


Tuesday, October 17, 2017
NZDUSD analysis for 17.10.2017
New Zealand has published Inflation Rate QoQ and the US will release Industrial Production MoM, Foreign Bond Investment and Monthly Budget Statement.
The support rests in 0.71520 with resistance at 0.71960 which both lines are above the weekly pivot point at 0.71370. The EMA of 10 is moving with bullish bias along the ascendant channel and it is below the EMA of 200 and above the EMA of 100. The RSI is rising above the 50 level, the MACD indicator is in positive territory and the Stochastic is moving in low ranges. The ADX is showing buy signals. The price is above the Ichimoku Cloud and the Chinkou Span. The Tenkan-sen and the Kijun-sen are both showing a horizontal trend.
Long positions are recommended towards 0.725.
https://fxglory.com/nzdusd-analysis-for-17-10-2017/
GBPUSD analysis for 17.10.2017
Today the UK will publish CPI inflation data and also the BOE Governor Carney makes a speech which will be influential for GBPUSD.
The support rests at 1.32070 with resistance at 1.32820 which the weekly pivot point at 1.32310 is located in between the lines. The EMA of 10 is moving with bearish bias in the ascendant channel and it is above the EMA of 200 and the EMA of 100. The RSI is moving on the 50 level, the Stochastic is showing downward momentum and the MACD indicator is in positive territory. The ADX is not showing any clear signals.
Long positions are recommended towards 1.33.
https://fxglory.com/gbpusd-analysis-for-17-10-2017/
EURUSD analysis for 17.10.2017
USD has been empowered since there are no signs of missile launch from the North Korea.
The support rests at 1.17370 with resistance at 1.17850 which both lines are below the weekly pivot point at 1.18050. The EMA of 10 is moving with bearish bias in the descendant channel and it is below the EMA of 200 and the EMA of 100. The RSI is falling towards the oversold area, the Stochastic is moving in low ranges and the MACD indicator is in neutral territory. The ADX is showing buy signals.
The price will decline towards 1.170 but then buyers can take profit of the correction pattern.
https://fxglory.com/eurusd-analysis-for-17-10-2017/
Monday, October 16, 2017
USDJPY analysis for 16.10.2017
Japan has published the Revised Industrial Production m/m data and the US will release Federal Budget Balance and Empire State Manufacturing Index.
The support rests at 111.570 with resistance at 111.910 which both lines are below the weekly pivot point at 112.110. The EMA of 10 is moving with bearish bias in the descendant channel but it is below the EMA of 100 and above the EMA of 200. The RSI is falling towards the oversold area, the Stochastic is moving in low ranges and the MACD indicator is in negative territory. The ADX is showing sell signals.
Short positions are recommended towards 111.45.
https://fxglory.com/usdjpy-analysis-for-16-10-2017/

USDCHF analysis for 16.10.2017
USD is acting weak because of poor economic data and Switzerland is not publishing any influential reports.
The support rests at 0.97370 with resistance at 0.97700 which the weekly pivot point at 0.97510 is located in between the lines. The EMA of 10 is moving with bullish bias in the descendant channel and it is located above the EMA of 200 and the EMA of 100. The RSI is moving on the 50 level, the MACD indicator is in negative territory and the Stochastic is showing upward momentum. The ADX is not showing buy signals. The price is in the Ichimoku Cloud and above the Chinkou Span. The Tenkan-sen is showing a horizontal trend while the Kijun-sen is showing a downward trend.
The support level breakthrough will drag the price down to 0.9710 otherwise it will continue its bullish trend.
https://fxglory.com/usdchf-analysis-for-16-10-2017/


EURUSD analysis for 16.10.2017
the FOMC minutes and the CPI data weakened USD.
The support rests at 1.17610 with resistance at 1.18260 which the weekly pivot point at 1.18050 is located in between the lines. The EMA of 10 is moving with bearish bias along the descendant channel and it is below the EMA of 200 and above the EMA of 100. The RSI is falling towards the oversold area, the Stochastic is showing downward momentum and the MACD indicator is in neutral territory. The ADX is showing sell signals.
Short positions are recommended towards 1.1716.
https://fxglory.com/eurusd-analysis-for-16-10-2017/


Thursday, October 12, 2017
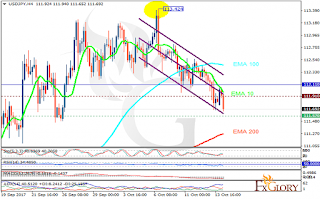
USDJPY analysis for 12.10.2017
Japan has published Tertiary Industry Index MoM and the US will release Initial Jobless Claims and Core PPI MoM.
The support rests at 112.220 with resistance at 112.600 which both lines are below the weekly pivot point at 112.790. The EMA of 10 is moving with bearish bias in the ascendant channel but it is above the EMA of 200 and the EMA of 100. The RSI is moving below the 50 level, the Stochastic is showing downward momentum and the MACD indicator is in negative territory. The ADX is showing weak buy signals.
Despite the bearish signals, the support area seems to be too strong to be broken therefore, the price will grow towards 113 area.
https://fxglory.com/usdjpy-analysis-for-12-10-2017/


USDCAD analysis for 12.10.2017
The oil market has a great influence on CAD. Today Canada will publish New Housing Price Index MoM and YoY along with the US which releases Initial Jobless Claims and EIA Crude Oil Stocks Change.
The pair is finding support at 1.24200 with resistance at 1.24690 which both lines are below the weekly pivot point at 1.25250. The EMA of 10 is moving with bearish bias in the ascendant channel but it is above the EMA of 100 and the EMA of 200. The RSI is moving in oversold area, the MACD indicator is in negative territory and the Stochastic is showing downward momentum. The ADX is showing buy signals. The price is below the Ichimoku Cloud and the Chinkou Span. The Tenkan-sen and the Kijun-sen are both showing a horizontal trend.
The support level breakthrough will pave the way for further decline towards 1.20 otherwise, USDCAD will grow targeting 1.30.
https://fxglory.com/usdcad-analysis-for-12-10-2017/


EURUSD analysis for 12.10.2017
EUR is acting strong against USD which is not supported by the economic reports and the FOMC minutes.
The support rests at 1.18430 with resistance at 1.18910 which both lines are above the weekly pivot point at 1.17390. The EMA of 10 is moving with bullish bias in the ascendant channel and it is above the EMA of 200 and the EMA of 100. The RSI is moving in overbought area, the Stochastic is moving in high ranges and the MACD indicator is in positive territory. The ADX is showing buy signals.
Long positions are recommended towards 1.20.
https://fxglory.com/eurusd-analysis-for-12-10-2017/


Tuesday, October 10, 2017
USDJPY analysis for 10.10.2017
Japan is publishing the Economy Watchers Sentiment and Current Account data and the US will release IBD/TIPP Economic Optimism and NFIB Small Business Index.
The support rests at 112.160 with resistance at 112.580 which both lines are below the weekly pivot point at 112.790. The EMA of 10 is moving with bearish bias in the ascendant channel but it is above the EMA of 100 and the EMA of 200. The RSI is falling towards the oversold area, the Stochastic is showing downward momentum and the MACD indicator is in neutral territory. The ADX is showing sell signals.
Short positions are recommended towards 111.5.
https://fxglory.com/usdjpy-analysis-for-10-10-2017/


NZDUSD analysis for 10.10.2017
NZD is chiefly sensitive to the commodities market.
The support rests at 0.70550 with resistance at 0.70840 which both lines are below the weekly pivot point at 0.71230. The EMA of 10 is moving with bearish bias along the descendant channel and it is below the EMA of 100 and 200. The RSI is moving in the oversold area, the MACD indicator is in negative territory and the Stochastic is moving in middle ranges. The ADX is not showing any clear signals. The price is below the Ichimoku Cloud and the Chinkou Span. The Tenkan-sen and the Kijun-sen are both showing a downward trend.
Short positions are recommended towards 0.700.
https://fxglory.com/nzdusd-analysis-for-10-10-2017/


EURUSD analysis for 10.10.2017
Due to yesterday’s holiday in the US, USD is acting weak.
The support rests at 1.17500 with resistance at 1.18010 which both lines are above the weekly pivot point at 1.17390. The EMA of 10 is moving with bullish bias along the ascendant channel and it is below the EMA of 200 and the EMA of 100. The RSI is rising towards the overbought area, the Stochastic is moving in high ranges and the MACD indicator is in neutral territory. The ADX is showing buy signals.
Long positions are recommended towards 1.18.
https://fxglory.com/eurusd-analysis-for-10-10-2017/


Monday, October 9, 2017
USDCHF analysis for 09.10.2017
Switzerland is publishing Foreign Exchange Reserves which is the only influential event for USDCHF.
The support rests at 0.97690 with resistance at 0.97910 which both lines are above the weekly pivot point at 0.97610. The EMA of 10 is moving with bullish bias along the ascendant channel and it is located above the EMA of 200 and the EMA of 100. The RSI is moving horizontally above the 50 level, the MACD indicator is in positive territory and the Stochastic is moving in low ranges. The ADX is showing buy signals. The price is above the Ichimoku Cloud and below the Chinkou Span. The Tenkan-sen and the Kijun-sen are both showing a horizontal trend.
The resistance level breakout will push the pair to higher levels towards 0.985 otherwise it will drop to 0.974.
https://fxglory.com/usdchf-analysis-for-09-10-2017/


GBPUSD analysis for 09.10.2017
GBP is getting weak due to the domestic and political pressure on the UK. Today GBPUSD would not be volatile because of the US holiday and the UK is not releasing any economic reports.
The support rests at 1.30650 with resistance at 1.31320 which both lines are below the weekly pivot point at 1.31630. The EMA of 10 is moving with bearish bias in the descendant channel and it is below the EMA of 200 and below the EMA of 100. The RSI is rising towards the 50 level, the Stochastic is showing upward momentum and the MACD indicator is in negative territory. The ADX is showing buy signals.
Long positions are recommended towards 1.3291.
https://fxglory.com/gbpusd-analysis-for-09-10-2017/


EURUSD analysis for 09.10.2017
There are no economic reports in the US due to the holiday therefore EURUSD will be chiefly under the influence of Eurogroup Meeting.
The support rests at 1.17120 with resistance at 1.17540 which the weekly pivot point at 1.17390 is located in between the lines. The EMA of 10 is moving horizontally in the descendant channel and it is below the EMA of 200 and the EMA of 100. The RSI is moving on the 50 level, the Stochastic is moving in high ranges and the MACD indicator is in negative territory. The ADX is showing weak buy signals.
The resistance level seems to be too strong to be broken, therefore short positions are recommended towards 1.16530.
https://fxglory.com/eurusd-analysis-for-09-10-2017/


Friday, October 6, 2017
USDJPY analysis for 06.10.2017
Japan has published the Leading Indicators and Average Cash Earnings y/y data and the US will release Consumer Credit m/m, Unemployment Rate and Non-Farm Employment Change.
The support rests at 112.840 with resistance at 113.160 which both lines are above the weekly pivot point at 112.390. The EMA of 10 is moving with bullish bias in the ascendant channel and it is above the EMA of 100 and the EMA of 200. The RSI is falling towards the 50 level, the Stochastic is moving in high ranges and the MACD indicator is in neutral territory. The ADX is showing buy signals.
USDJPY will continue its bullish trend towards 113.55.
https://fxglory.com/usdjpy-analysis-for-06-10-2017/


Gold analysis for 06.10.2017
Gold has been moving with bearish bias because of the strong USD.
The support rests at 1266.42 with resistance at 1273.40 which both lines are below the weekly pivot point at 1293.37. The EMA of 10 is moving with bearish bias along the descendant channel and it is below the EMA of 200 and the EMA of 100. The RSI is moving in oversold area, the Stochastic is moving in low ranges and the MACD indicator is in negative territory. The ADX is not showing any clear signals. The price is below the Ichimoku Cloud and above the Chinkou Span. The Tenkan-sen and the Kijun-sen are both showing a horizontal trend.
The resistance level breakout will be a sign for gold correction pattern towards 1280, otherwise it will decline towards 1240.
https://fxglory.com/gold-analysis-for-06-10-2017/


EURUSD analysis for 06.10.2017
The factory orders data supported USD and today, most probably, USD will be empowered by the NFP data and the wages data as well.
The support rests at 1.16750 with resistance at 1.17170 which both lines are below the weekly pivot point at 1.18220. The EMA of 10 is moving with bearish bias along the descendant channel and it is below the EMA of 200 and the EMA of 100. The RSI is moving in oversold area, the Stochastic is moving in low ranges and the MACD indicator is in negative territory. The ADX is showing sell signals.
Short positions are recommended towards 1.15.
https://fxglory.com/eurusd-analysis-for-06-10-2017/


Thursday, October 5, 2017
GBPUSD analysis for 05.10.2017
The market did not react to the several economic reports being published in the US yesterday and today the US will release the unemployment claims.
The support rests at 1.32150 with resistance at 1.32690 which both lines are below the weekly pivot point at 1.34350. The EMA of 10 is moving with bearish bias in the descendant channel but it is above the EMA of 200 and below the EMA of 100. The RSI is moving in oversold area, the Stochastic is moving in low ranges and the MACD indicator is in negative territory. The ADX is showing buy signals.
Short positions are recommended towards 1.31 area. If the resistance level is broken, GBPUSD will grow to 1.34.
https://fxglory.com/gbpusd-analysis-for-05-10-2017/


EURUSD analysis for 05.10.2017
EURUSD has not been volatile in spite the fact that yesterday several economic reports were published and Yellen and Draghi spoke.
The support rests at 1.17470 with resistance at 1.17700 which both lines are below the weekly pivot point at 1.18220. The EMA of 10 is moving horizontally in the ascendant channel and it is below the EMA of 200 and the EMA of 100. The RSI is moving on the 50 level, the Stochastic is showing downward momentum and the MACD indicator is in negative territory. The ADX is not showing any clear signals.
The support level breakthrough will ease the way for price decline towards 1.15 area, otherwise it will grow to 1.18.
https://fxglory.com/eurusd-analysis-for-05-10-2017/


AUDUSD analysis for 05.10.2017
Australia has published Balance of Trade and Exports and Import MoM and later the US will release Balance of Trade and the unemployment claims.
The support rests in 0.78160 with resistance at 0.78460 which both lines are below the weekly pivot point at 0.78670. The EMA of 10 is moving with bearish bias along the descendant channel and it is located below the EMA of 100 and the EMA of 200. The RSI is falling towards the oversold area, the MACD indicator is in negative territory and the Stochastic is showing downward momentum. The ADX is not showing any clear signals. The price is below the Ichimoku Cloud and the Chinkou Span. The Tenkan-sen is showing an upward trend while the Kijun-sen is showing a horizontal trend.
AUDUSD will continue its bearish trend towards 0.778.
https://fxglory.com/audusd-analysis-for-05-10-2017/


Wednesday, October 4, 2017
USDJPY analysis for 04.10.2017
The US is releasing Crude Oil Inventories, ISM Non-Manufacturing PMI, Final Services PMI and ADP Non-Farm Employment Change but Japan is not publishing any economic reports.
The support rests at 112.520 with resistance at 112.800 which both lines are above the weekly pivot point at 112.390. The EMA of 10 is moving with bullish bias in the ascendant channel and it is above the EMA of 100 and the EMA of 200. The RSI is moving horizontally on the 50 level, the Stochastic is moving in low ranges and the MACD indicator is in positive territory. The ADX is showing sell signals.
Regardless of the pullbacks, USDJPY will continue its bullish trend towards 113.2.
https://fxglory.com/usdjpy-analysis-for-04-10-2017/


USDCHF analysis for 04.10.2017
Switzerland is not publishing any economic data but the US is releasing ISM Non-Manufacturing PMI and ADP Employment Change.
The support rests at 0.97080 with resistance at 0.97710 which both lines are above the weekly pivot point at 0.96950. The EMA of 10 is moving with bullish bias along the ascendant channel and it is located above the EMA of 200 and the EMA of 100. The RSI is moving on the 50 level, the MACD indicator is in positive territory and the Stochastic is showing upward momentum. The ADX is not showing any clear signals. The price is above the Ichimoku Cloud and the Chinkou Span. The Tenkan-sen and the Kijun-sen are both showing a horizontal trend.
The support level breakthrough will drag the price down to 0.9685 otherwise it will continue its bullish trend.
https://fxglory.com/usdchf-analysis-for-04-10-2017/


EURUSD analysis for 04.10.2017
The key influential event for EURUSD has been the Fed rate hike. Today ADP employment data and the Non-manufacturing PMI data will be released in the US as well.
The support rests at 1.17540 with resistance at 1.17860 which both lines are below the weekly pivot point at 1.18220. The EMA of 10 is moving with bullish bias along the ascendant channel but it is below the EMA of 200 and the EMA of 100. The RSI is moving on the 50 level, the Stochastic is moving in high ranges and the MACD indicator is in negative territory. The ADX is not showing any clear signals.
Long positions are recommended towards the 38.2 level of Fibonacci.
https://fxglory.com/eurusd-analysis-for-04-10-2017/


Monday, October 2, 2017
USDJPY analysis for 02.10.2017
USDJPY will be volatile today due to several economic reports such as Final Manufacturing PMI, Tankan Non-Manufacturing Index and Tankan Manufacturing Index data in Japan and the US will publish ISM Manufacturing Prices, Construction Spending m/m, ISM Manufacturing PMI and Final Manufacturing PMI.
The support rests at 112.700 with resistance at 113.020 which both lines are above the weekly pivot point at 112.390. The EMA of 10 is moving with bullish bias along the ascendant channel and it is above the EMA of 200 and the EMA of 100. The RSI is moving above the 50 level, the Stochastic is showing upward momentum and the MACD indicator is in positive territory. The ADX is showing buy signals.
Long positions are recommended towards 113.5.
https://fxglory.com/usdjpy-analysis-for-02-10-2017/


NZDUSD analysis for 02.10.2017
NZD has been under pressure due to the Reserve Bank of New Zealand’s (RBNZ) monetary policy decision.
The support rests in 0.71700 with resistance at 0.72170 which both lines are below the weekly pivot point at 0.72290. The EMA of 10 is moving with bearish bias along the descendant channel and it is below the EMA of 200 and the EMA of 100. The RSI is falling towards the 50 level, the MACD indicator is in negative territory and the Stochastic is moving in low ranges. The ADX is not showing any clear signals. The price is below the Ichimoku Cloud and the Chinkou Span. The Tenkan-sen and the Kijun-sen are both showing a downward trend.
Short positions are recommended towards 0.715.
https://fxglory.com/nzdusd-analysis-for-02-10-2017/


EURUSD analysis for 02.10.2017
EURUSD has been moving with bearish bias due to the USD empowerment. Now traders are waiting for the Unemployment Rate in Europe and ISM Manufacturing PMI in the US.
The support rests at 1.17460 with resistance at 1.17880 which both lines are below the weekly pivot point at 1.18220. The EMA of 10 is moving with bearish bias along the descendant channel and it is below the EMA of 200 and the EMA of 100. The RSI is falling towards the oversold area, the Stochastic is showing downward momentum and the MACD indicator is in negative territory. The ADX is not showing any clear signals.
Sellers can target 1.70 area.
https://fxglory.com/eurusd-analysis-for-02-10-2017/


Subscribe to:
Posts (Atom)