Monday, July 10, 2017
USDCAD analysis for 10.07.2017
The oil market is putting pressure on CAD, on the other hand, CAD is being supported by the Canadian employment report.
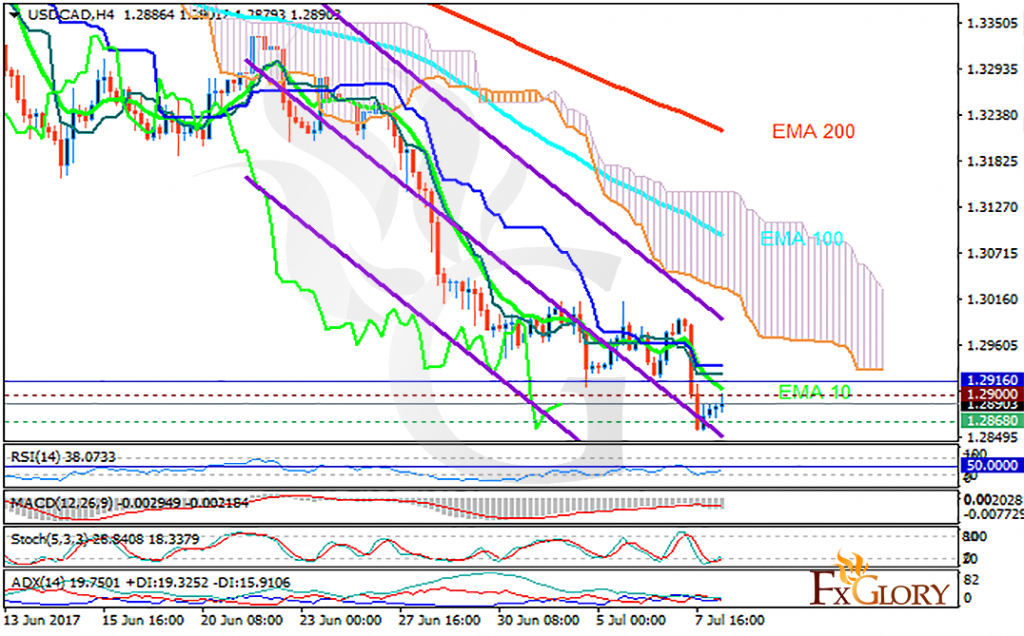
The pair is finding support at 1.28680 with resistance at 1.29000 which both lines are below the weekly pivot point at 1.29160. The EMA of 10 is moving with bearish bias along the descendant channel and it is below the EMA of 100 and the EMA of 200. The RSI is rising towards the 50 level, the MACD indicator is in negative territory and the Stochastic is showing upward momentum. The ADX is not showing any clear signals. The price is below the Ichimoku Cloud and above the Chinkou Span. The Tenkan-sen and the Kijun-sen are both showing a horizontal trend.
The resistance level breakout will smooth the way for further growth towards 1.31 otherwise it will drop to 1.25
https://fxglory.com/usdcad-analysis-for-10-07-2017/

Subscribe to:
Post Comments (Atom)
No comments:
Post a Comment