Monday, July 17, 2017
USDCHF analysis for 17.07.2017
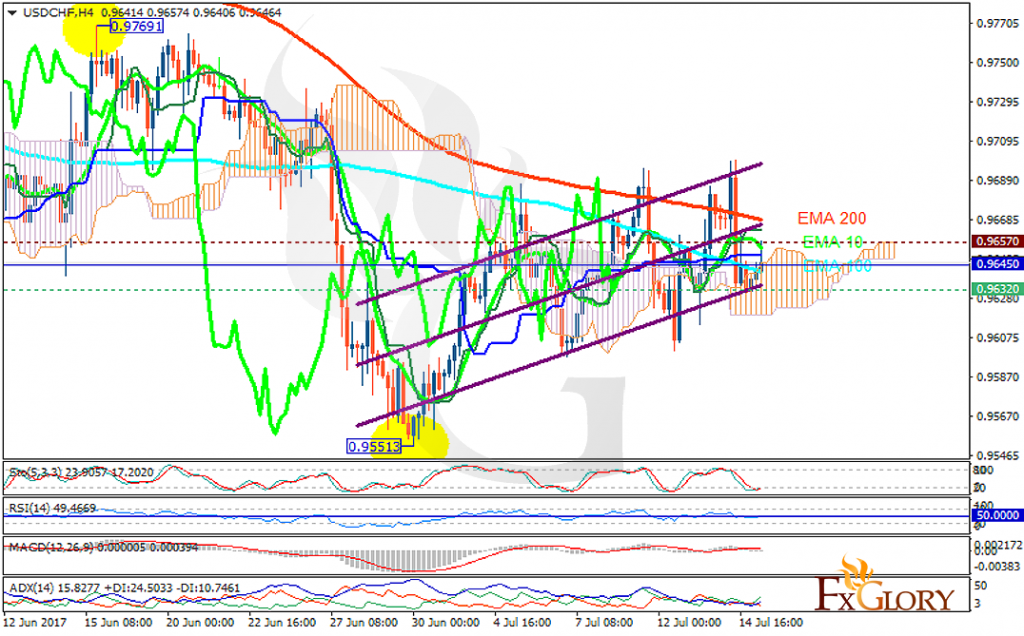
USDCHF has been growing up with high volatility since the beginning of July.
The support rests at 0.96320 with resistance at 0.96570 which the weekly pivot point at 0.96450 is located in between the lines. The EMA of 10 is moving with bearish bias and it is located below the EMA of 200 and above the EMA of 100. The RSI is moving horizontally on the 50 level, the MACD indicator is in neutral territory and the Stochastic is moving in low ranges. The ADX is showing buy signals. The price is in the Ichimoku Cloud and above the Chinkou Span. The Tenkan-sen and the Kijun-sen are both showing a horizontal trend.
Long positions are recommended targeting 0.9770.
https://fxglory.com/usdchf-analysis-for-17-07-2017/
Subscribe to:
Post Comments (Atom)
No comments:
Post a Comment