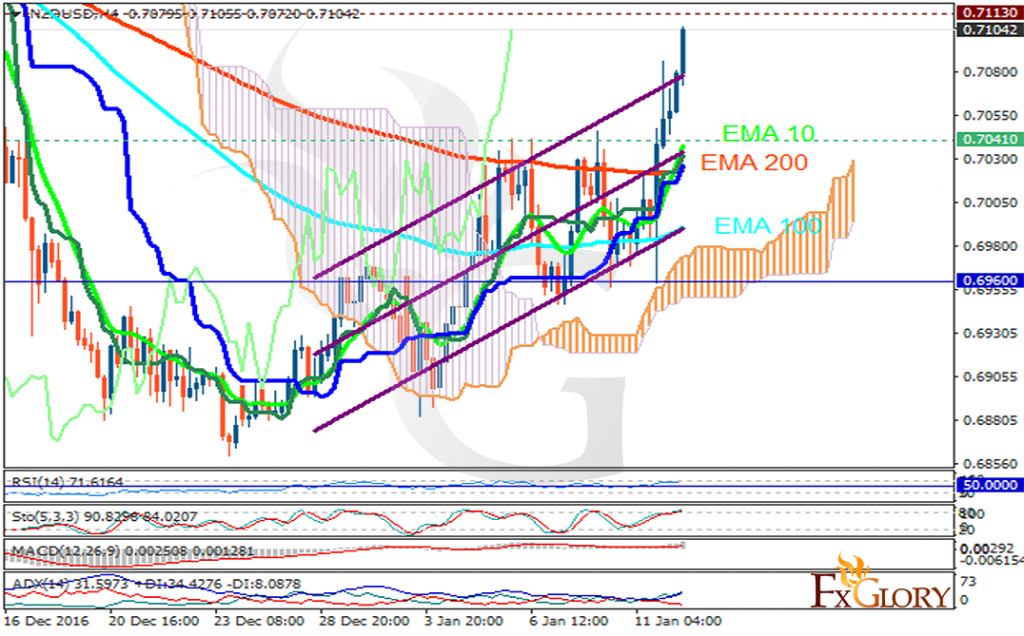
The oil price is leaving a negative impact on NZD. The support rests in 0.70410 with resistance at 0.71130 which both lines are above the weekly pivot point at 0.69600. The EMA of 10 is moving with bullish bias and it is located above the EMA of 100 and the EMA of 200. The RSI is moving in overbought area, the MACD indicator is in positive territory and the Stochastic is moving horizontally in its maximum ranges. The ADX is showing a buy signal. The price is above the Ichimoku Cloud and the Chinkou Span. The Tenkan-sen and the Kijun-sen are both showing upward trend. The resistance level breakout will make it difficult for the pair to grow higher, therefore short positions are recommended targeting 0.6950.
https://fxglory.com/nzdusd-analysis-for-12-01-2017/
No comments:
Post a Comment