Technical analysis of GBPUSD dated 05.04.2016
GBPUSD is under the influence of Brexit, oil market and the business activity index and is expected to move in lower ranges. The support stays at 1.42400 with resistance at 1.43200. As the support has already been broken the price is going to fall and reach lower levels. The EMA of 50 is located above the EMA of 100. The MACD indicator is in negative territory showing the price decrease and the RSI is below the 50 level. The price is above the Chinkou Span and in Ichimoku Cloud. The Kijun sen is showing a horizontal trend while the Tenkan sen is showing and downward movement. Short positions are recommended with the target at 1.4160.
https://fxglory.com/technical-analysis-of-gbpusd-dated-05-04-2016/
Tuesday, April 5, 2016
Technical analysis of USDJPY dated 05.04.2016
JPY is not affected by any specific news factor for today but instead USD performance is mixed with bearish and bullish pattern. Despite the fact that US has created many new jobs in comparison to the last year, the average wage growth will lead to the inflationary pressure increase. USDJPY has been declining since March highest point at 114.440 which led the pair to a sharp fall to 110.619 but bulls tried to push the price higher to 113.822 but could not break the 114.440 level and the price has been falling down the descendant channel ever since. The EMA of 100 is above the EMA of 50. The MACD indicator is in negative territory confirming the bearish pattern and the RSI is staying below the 50 level. Good news for sellers, the price is falling and it might go down to 109.80.
https://fxglory.com/technical-analysis-of-usdjpy-dated-05-04-2016/
JPY is not affected by any specific news factor for today but instead USD performance is mixed with bearish and bullish pattern. Despite the fact that US has created many new jobs in comparison to the last year, the average wage growth will lead to the inflationary pressure increase. USDJPY has been declining since March highest point at 114.440 which led the pair to a sharp fall to 110.619 but bulls tried to push the price higher to 113.822 but could not break the 114.440 level and the price has been falling down the descendant channel ever since. The EMA of 100 is above the EMA of 50. The MACD indicator is in negative territory confirming the bearish pattern and the RSI is staying below the 50 level. Good news for sellers, the price is falling and it might go down to 109.80.
https://fxglory.com/technical-analysis-of-usdjpy-dated-05-04-2016/
Technical analysis of EURUSD dated 05.04.2016
EURO is gaining and losing power due to the data released by the government such as the unemployment rate, the index growth, 10-year German government bonds yield and the manufacturing PMI in Germany. On the other side, USD is facing falls considering the decline of new orders for factory goods. As the result, EURUSD may move above the weekly pivot point at 1.13260 and climb the ascendant channel. The support resides at 1.13810 with resistance at 1.14010. The EMA of 50 is located above the EMA of 100. From the beginning of March this pair is capturing new highs starting with 1.1219 then 1.13390 followed by 1.14373 and leaving only one low at 1.08205. There is a slight chance that today it leaves another new high. The MACD indicator is in positive territory confirming the price growth with the RSI staying above the 50 level. The resistance level breakout at 1.14010 will smooth the way for further rise. Buyers can target 1.1550 level.
https://fxglory.com/technical-analysis-of-eurusd-dated-05-04-2016/
EURO is gaining and losing power due to the data released by the government such as the unemployment rate, the index growth, 10-year German government bonds yield and the manufacturing PMI in Germany. On the other side, USD is facing falls considering the decline of new orders for factory goods. As the result, EURUSD may move above the weekly pivot point at 1.13260 and climb the ascendant channel. The support resides at 1.13810 with resistance at 1.14010. The EMA of 50 is located above the EMA of 100. From the beginning of March this pair is capturing new highs starting with 1.1219 then 1.13390 followed by 1.14373 and leaving only one low at 1.08205. There is a slight chance that today it leaves another new high. The MACD indicator is in positive territory confirming the price growth with the RSI staying above the 50 level. The resistance level breakout at 1.14010 will smooth the way for further rise. Buyers can target 1.1550 level.
https://fxglory.com/technical-analysis-of-eurusd-dated-05-04-2016/
Monday, April 4, 2016
Technical analysis of GBPUSD dated 04.04.2016
The British bond yields beat its counterparts the US and Germany but instead pound fell against the strong USD. USD gained momentum by the wage growth and on the other side GBP still facing the fear of Brexit and the negative impact of manufacturing PMI data. The pair is finding support at 1.4160 with the resistance at 1.4240. The RSI is below the 50 level and the MACD indicator is in neutral zone showing the price correction. The EMA of 50 is meeting the EMA of 11 at 1.4281. Traders can wait for a better trading setup. From the upside, the 1.4514 breakout will push the price higher changing resistance to 1.4667 and on the other hand, 1.4052 break will complete the rebound from 1.3837 therefore may drop the price lower.
https://fxglory.com/technical-analysis-of-gbpusd-dated-04-04-2016/
The British bond yields beat its counterparts the US and Germany but instead pound fell against the strong USD. USD gained momentum by the wage growth and on the other side GBP still facing the fear of Brexit and the negative impact of manufacturing PMI data. The pair is finding support at 1.4160 with the resistance at 1.4240. The RSI is below the 50 level and the MACD indicator is in neutral zone showing the price correction. The EMA of 50 is meeting the EMA of 11 at 1.4281. Traders can wait for a better trading setup. From the upside, the 1.4514 breakout will push the price higher changing resistance to 1.4667 and on the other hand, 1.4052 break will complete the rebound from 1.3837 therefore may drop the price lower.
https://fxglory.com/technical-analysis-of-gbpusd-dated-04-04-2016/
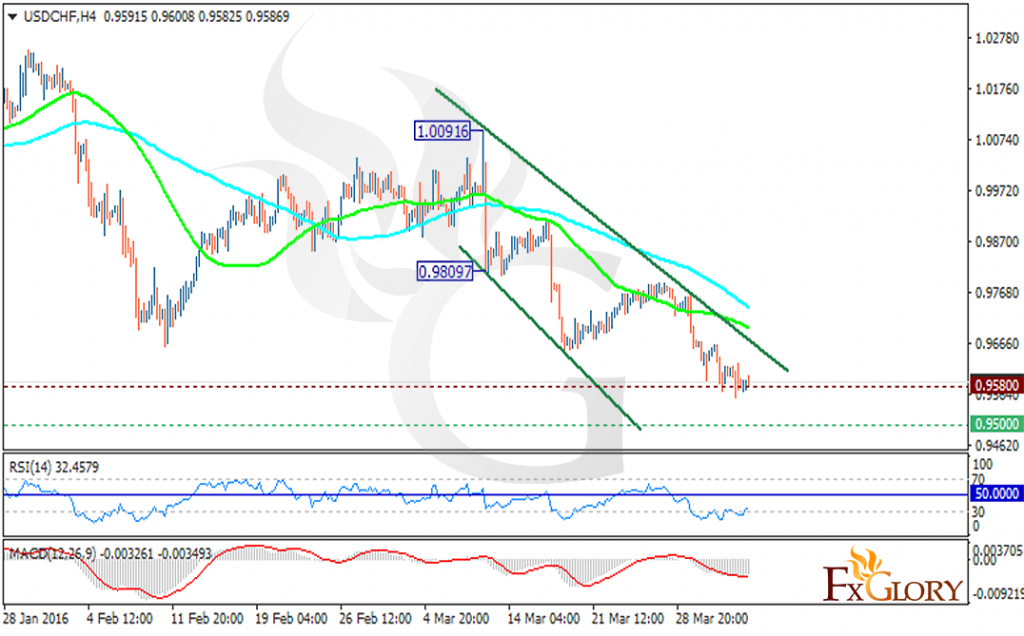
Technical analysis of USDCHF dated 04.04.2016
USDCHF is influenced by the retail sales for February and the business PMI report of Switzerland. At the moment the pair is expected to fluctuate in lower ranges creating new lower highs and lower lows. In the H4 chart of USDCHF the price is finding support at 0.9500 with resistance at 0.9580. The RSI is staying below the 50 level and the MACD indicator is in negative territory showing the price fall. The SMA of 50 is remaining below the SMA of 100. Short positions are recommended targeting 0.9555 and the break of this level will confirm the downward trend towards the support level.
https://fxglory.com/technical-analysis-of-usdchf-dated-04-04-2016/
USDCHF is influenced by the retail sales for February and the business PMI report of Switzerland. At the moment the pair is expected to fluctuate in lower ranges creating new lower highs and lower lows. In the H4 chart of USDCHF the price is finding support at 0.9500 with resistance at 0.9580. The RSI is staying below the 50 level and the MACD indicator is in negative territory showing the price fall. The SMA of 50 is remaining below the SMA of 100. Short positions are recommended targeting 0.9555 and the break of this level will confirm the downward trend towards the support level.
https://fxglory.com/technical-analysis-of-usdchf-dated-04-04-2016/
Technical analysis of EURUSD dated 04.04.2016
The important News factors for EURUSD are the Manufacturing Sector PMI in Europe and the unemployment rate staying at 10.3% level. The pair is finding support at 1.1373 with resistance at 1.1402 climbing the ascendant channel. The RSI is above 50 level and the MACD indicator is in positive territory showing the price correction. The price is above the Ichimoku Cloud and the Chinku Span. The Kijun-sen is signaling a horizontal trend while the Tenkan-sen is confirming the price growth. Buyers can open their orders and target 1.1450 which may even reach 1.1550.
https://fxglory.com/technical-analysis-of-eurusd-dated-04-04-2016/
The important News factors for EURUSD are the Manufacturing Sector PMI in Europe and the unemployment rate staying at 10.3% level. The pair is finding support at 1.1373 with resistance at 1.1402 climbing the ascendant channel. The RSI is above 50 level and the MACD indicator is in positive territory showing the price correction. The price is above the Ichimoku Cloud and the Chinku Span. The Kijun-sen is signaling a horizontal trend while the Tenkan-sen is confirming the price growth. Buyers can open their orders and target 1.1450 which may even reach 1.1550.
https://fxglory.com/technical-analysis-of-eurusd-dated-04-04-2016/
Technical analysis of AUDUSD dated 04.04.2016
Last week AUD was stronger than USD due to the Yellen’s speech which affected many currency pairs but at the end of the week the pair declined correcting its bullish trend for a couple of times but reversed up again. Today retail sales stats for February and building permits report are going to affect this pair and for the week the rate decision by RBA will get all the attentions. Recently the price has been moving above the SMA of 50 which is above the SMA of 100 climbing the ascendant channel marked in green. Early today the price fell getting closer to the H4 pivot point at 0.76430. It is finding support at 0.7595 with resistance at 0.7691. The RSI indicator is on 50 level and the MACD indicator is showing a downward trend. At the moment there is no enough signs for traders to decide on their orders but bearish would more probable as the price is correcting.
https://fxglory.com/technical-analysis-of-audusd-dated-04-04-2016/
Last week AUD was stronger than USD due to the Yellen’s speech which affected many currency pairs but at the end of the week the pair declined correcting its bullish trend for a couple of times but reversed up again. Today retail sales stats for February and building permits report are going to affect this pair and for the week the rate decision by RBA will get all the attentions. Recently the price has been moving above the SMA of 50 which is above the SMA of 100 climbing the ascendant channel marked in green. Early today the price fell getting closer to the H4 pivot point at 0.76430. It is finding support at 0.7595 with resistance at 0.7691. The RSI indicator is on 50 level and the MACD indicator is showing a downward trend. At the moment there is no enough signs for traders to decide on their orders but bearish would more probable as the price is correcting.
https://fxglory.com/technical-analysis-of-audusd-dated-04-04-2016/
Subscribe to:
Posts (Atom)