EURUSD is chiefly affected by the US economic news since there is no special report in Eurozone for today. The US is announcing and Empire State Manufacturing Index, TIC Long-Term Purchases and NAHB Housing Market Index. EURUSD is moving with bearish bias creating support at 1.12960 with resistance at 1.13220 which both lines are below the monthly pivot point at 1.13740. The EMA of 10 is located below the EMA of 50 suggesting the price decline in the last recent days. All indicators are signaling sell opportunity such as MACD which is in negative territory, the RSI is below 50 and the ADX is showing strong sellers. Sellers can expect the price to touch 1.1150.
https://fxglory.com/technical-analysis-of-eurusd-dated-16-05-2016/
Monday, May 16, 2016
Friday, May 13, 2016
Technical analysis of USDCAD dated 13.05.2016
USDCAD is chiefly affected by Canada’s housing price index and for today there is no economic news in Canada. Market will be more active next week with the release of nation’s consumer price index, retail sales and BoC review report. The pair is finding support at 1.28290 with resistance at 1.28790 which both lines are above the weekly pivot point at 1.27720. The pair might fall down the descendant channel creating another bottom at 1.24610. The price is expected to move in lower ranges due to the oil market as well. Moreover the MACD indicator and the RSI are in neutral zone but the ADX is showing strong buyers suggesting that the price will follow the Andrews’ pitchfork. There is no clear signal at the moment so traders can wait for a better chart setup.
https://fxglory.com/technical-analysis-of-usdcad-dated-13-05-2016/
https://fxglory.com/technical-analysis-of-usdcad-dated-13-05-2016/
Technical analysis of USDJPY dated 13.05.2016
Today USDJPY is under the influence of some economic news reports such as M2 Money Stock y/y and Tertiary Industry Activity m/m in Japan and the US is announcing Core Retail Sales m/m, Business Inventories m/m, the Revised UoM Inflation Expectations and Retail Sales m/m therefore this pair will be more active. USDJPY is finding support at 108.59 with resistance at 109.050 which both lines are above the weekly pivot point at 106.690. The pair is climbing the ascendant channel. The EMA of 10 is moving above the EMA of 50 suggesting the price growth over the last recent days. All indicators are showing buy signal; the price is above the Ichimoku Cloud and the Chinkou Span. The Kijun-sen and the Tenkan-sen show a horizontal movement. The MACD indicator is in positive territory confirming the buy signal and the RSI is above the 50 level. The resistance breakout will pave the way for 109.80.
https://fxglory.com/technical-analysis-of-usdjpy-dated-13-05-2016/
https://fxglory.com/technical-analysis-of-usdjpy-dated-13-05-2016/
Technical analysis of USDCHF dated 13.05.2016
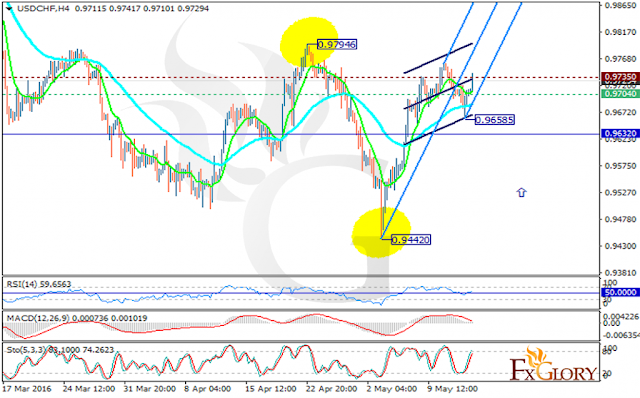
Today there is no economic news in Switzerland to affect USDCHF but there would be nation’s producer & import prices data for April which will be released next week. After yesterday rally this pair is expected to trade in higher ranges. The support lies at 0.97040 with resistance at 0.97350 which both lines are above the weekly pivot point at 0.96320. The EMA of 10 is located above the EMA of 50 showing the current price movement in higher levels. The MACD indicator is in positive territory signaling the price growth and the RSI is getting close to the 50 level. The stochastic is confirming the bullish scenario as well. It seems that the pair is climbing within the Andrews’ pitchfork. Long positions are recommended with the target at 0.9735.
https://fxglory.com/technical-analysis-of-usdchf-dated-13-05-2016/
https://fxglory.com/technical-analysis-of-usdchf-dated-13-05-2016/
Thursday, May 12, 2016
Technical analysis of EURGBP dated 12.05.2016
EURGBP is under the influence of Britain’s industrial production which rose less than expected rate and Euro-zone’s industrial production data for March. At the moment the pair is finding support at 0.79020 with resistance at 0.79180 which both lines are above the weekly pivot point at 0.78800. It seems that EURGBP is climbing up the ascendant channel within the Andrews’ pitchfork. The indicators are staying in neutral zone such as the MACD and RSI. The ADX is showing stronger buyers than sellers. The EMA of 10 is located above the EMA of 50. It is hard to decide whether the price goes up or down. Pullbacks are facing too much support and makes selling almost difficult. It might be a good idea to wait for a while.
https://fxglory.com/technical-analysis-of-eurgbp-dated-12-05-2016/
https://fxglory.com/technical-analysis-of-eurgbp-dated-12-05-2016/
Technical analysis of EURUSD dated 12.05.2016
EUR has lost its power due to the German 10-year government bonds yield which decreased. Today bears may become more active. On Wednesday EURUSD created a new high and has been falling down since then. The support lies at 1.14160 with resistance at 1.14320 which both lines are below the weekly pivot point 1.14680. If the pair climbs up the long term ascendant channel it may break the resistance level and reach 1.15000. However all the indicators are showing price decline within the Andrews’ pitchfork. The MACD indicator is in negative territory, the RSI is in neutral area and the stochastic is suggesting price drop as well. The support level breakthrough can push the pair in lower ranges targeting 1.1260.
https://fxglory.com/technical-analysis-of-eurusd-dated-12-05-2016/
https://fxglory.com/technical-analysis-of-eurusd-dated-12-05-2016/
Technical analysis of GBPUSD dated 12.05.2016
Today GBPUSD is mainly under the influence of Crude Oil Stocks change in the US and Bank of England announcement regarding the interest rates; however Industrial Production in the United Kingdom for March came lower than the expected rate. The price is finding support at 1.44260 with resistance at 1.44560 which both lines are below the weekly pivot point at 1.45360. Indicators are showing price decline; the MACD indicator is in negative territory, the RSI is below the 50 level and the Stochastic is signaling price fall as well. The EMA of 10 is located below the EMA of 50 confirming the price decline in the last recent days. Regarding the indicators signaling price fall, short positions are recommended targeting 1.4400.
https://fxglory.com/technical-analysis-of-gbpusd-dated-12-05-2016/
https://fxglory.com/technical-analysis-of-gbpusd-dated-12-05-2016/
Subscribe to:
Posts (Atom)


