
Thursday, July 6, 2017
AUDUSD analysis for 06.07.2017
AUDUSD is chiefly under the influence of some economic data such as Balance of Trade in Australia and ADP Employment Change in the US.
The support rests at 0.75730 with resistance at 0.76230 which both lines are below the weekly pivot point at 0.76530. The EMA of 10 is moving with bearish bias and it has reached the EMA of 100 which both are above the EMA of 200. The RSI is rising towards the 50 level, the MACD indicator is in negative territory and the Stochastic is showing upward momentum. The ADX is not showing any clear signals. The price is below the Ichimoku Cloud and the Chinkou Span. The Tenkan-sen is showing a horizontal trend while the Kijun-sen is showing a downward trend.
The resistance level breakout will smooth the way for further growth targeting 0.77.
https://fxglory.com/11036/


Wednesday, July 5, 2017
NZDUSD analysis for 05.07.2017
NZDUSD will be volatile due to the Federal Reserve Meeting Minutes today.
The support rests at 0.72670 with resistance at 0.72970 which both lines are below the weekly pivot point at 0.73090. The EMA of 10 is moving with bearish bias but it is above the EMA of 100 and 200. The RSI is rising towards the 50 level, the MACD indicator is in negative territory and the Stochastic is showing downward momentum. The ADX is showing sell signals. The price is in the Ichimoku Cloud and above the Chinkou Span. The Tenkan-sen is showing a downward trend while the Kijun-sen is showing a horizontal trend.
Regardless of the price decline signals presented by the indicators, 0.726 level seems to be too strong to be broken therefore, the pair will continue its growth in long term trading targeting 0.73.
https://fxglory.com/nzdusd-analysis-for-05-07-2017/


GBPUSD analysis for 05.07.2017
The FOMC is releasing today along with the Services PMI data from the UK.
The support rests at 1.29050 with resistance at 1.29570 which the weekly pivot point at 1.29200 is located in between the lines. The EMA of 10 is moving with bearish bias along the descendant channel but it is above the EMA of 200 and the EMA of 100. The RSI is moving horizontally on the 50 level, the Stochastic is moving in low ranges and MACD indicator is in neutral territory. The ADX is showing weak sell signals.
1.290 level seems to be a strong supportive area therefore long positions are recommended targeting 1.3050.
https://fxglory.com/gbpusd-analysis-for-05-07-2017/


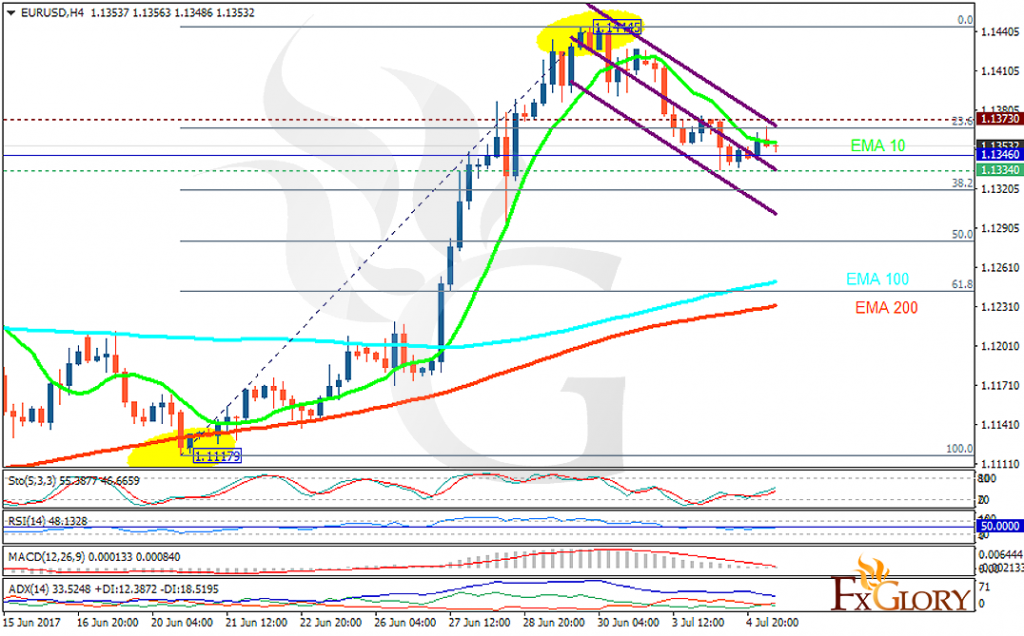
EURUSD analysis for 05.07.2017
EURUSD is chiefly under the influence of some economic reports such as Retail Sales m/m, Final Services PMI and German, French and Italian Final Services PMI in Eurozone along with the IBD/TIPP Economic Optimism and Factory Orders m/m in the US.
The support rests at 1.13340 with resistance at 1.13730 which the weekly pivot point at 1.13460 is located in between the lines. The EMA of 10 is moving with bearish bias along the descendant channel but it is above the EMA of 200 and the EMA of 100. The RSI is moving horizontally on the 50 level, the Stochastic is showing upward momentum and the MACD indicator is in neutral territory. The ADX is not showing any clear signals.
Short positions are recommended towards the 61.8 level of Fibonacci.
https://fxglory.com/eurusd-analysis-for-05-07-2017/

Tuesday, July 4, 2017
USDJPY analysis for 04.07.2017
Japan is releasing BOJ Core CPI y/y, 10-y Bond Auction and Monetary Base y/y data.
The support rests at 112.460 with resistance at 113.250 which both lines are above the weekly pivot point at 112.130. The EMA of 10 is moving with bullish bias along the ascendant channel and it is above the EMA of 100 and the EMA of 200. The RSI is falling towards the 50 level, the Stochastic is showing downward momentum and the MACD indicator is in positive territory. The ADX is not showing any clear signals.
Regardless of several pullbacks, the upward trend will continue towards 115 area.
https://fxglory.com/usdjpy-analysis-for-04-07-2017/


USDCHF analysis for 04.07.2017
There are no economic reports in the US due to the holiday.
The support rests at 0.96150 with resistance at 0.96410 which the weekly pivot point at 0.96250 is located in between the lines. The EMA of 10 is moving with bullish bias but it is located below the EMA of 200 and the EMA of 100. The RSI is moving horizontally on the 50 level, the MACD indicator is in neutral territory and the Stochastic is showing downward momentum. The ADX is showing buy signals. The price is in the Ichimoku Cloud and below the Chinkou Span. The Tenkan-sen is showing an upward trend while the Kijun-sen is showing a horizontal trend.
Long positions are recommended targeting 0.97.
https://fxglory.com/usdchf-analysis-for-04-07-2017/


EURUSD analysis for 04.07.2017
Due to the US holiday, the market is moving very slowly and the only influential economic event is ECB Praet Speech in Eurozone.
The support rests at 1.13360 with resistance at 1.13760 which the weekly pivot point at 1.13460 is located in between the lines. The EMA of 10 is moving with bearish bias along the descendant channel but it is above the EMA of 200 and the EMA of 100. The RSI is moving horizontally on the 50 level, the Stochastic is showing upward momentum and the MACD indicator is in positive territory. The ADX is showing poor sell signals.
EURUSD will continue its downward trend towards the 61.8 level of Fibonacci retracement.
https://fxglory.com/eurusd-analysis-for-04-07-2017/


Subscribe to:
Posts (Atom)