Monday, November 14, 2016

EURUSD analysis for 04.11.2016

EURUSD is under the influence of EURGBP decline and the US election. The support rests at 1.10760 with resistance at 1.11160 which both lines are above the weekly pivot point at 1.0945. The EMA of 10 is moving with bullish bias and it has crossed the EMA of 100 and EMA of 200. The RSI is moving in overbought area, the Stochastic is moving in neutral area and the MACD indicator is in positive territory. The ADX is not showing any clear signal at the moment. Considering the bearish scenario, the pair is targeting 1.1000.

https://fxglory.com/eurusd-analysis-for-04-11-2016/


Thursday, November 3, 2016

USDJPY analysis for 03.11.2016

USD is getting weak as the result of the election issues. The support rests at 102.380 with resistance at 103.240 which both lines are below the weekly pivot point at 104.640. The EMA of 10 is moving with bearish bias and it has crossed the EMA of 100 and it is now close to the EMA of 200. The RSI is moving in oversold area, the Stochastic is moving horizontally in its minimum rate and the MACD indicator is in negative territory. The ADX is showing stronger sell opportunity than buy. The pair is not going to fall lower than 102.50 therefore we will observe short term decline and after that correction pattern towards the 103 area.

https://fxglory.com/usdjpy-analysis-for-03-11-2016/


NZDUSD analysis for 03.11.2016

NZD is being supported due to the positive New Zealand’s labor market report. The support rests in 0.72690 with resistance at 0.73270 which both lines are above the weekly pivot point at 0.71500. The EMA of 10 is moving with bullish bias and it has crossed the EMA of 100 and the EMA of 200. The RSI is moving horizontally in overbought area, the MACD indicator is in positive territory and the Stochastic is moving in its maximum rate. The ADX is showing stronger buy opportunity than sell. Long positions are recommended targeting 0.7350.

https://fxglory.com/nzdusd-analysis-for-03-11-2016/


EURUSD analysis for 03.11.2016

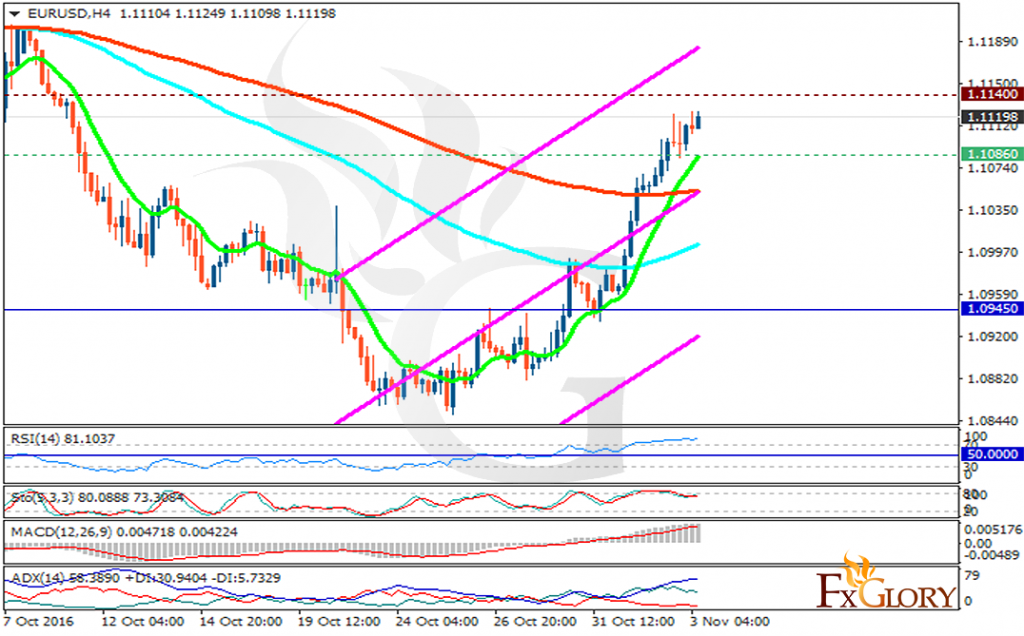
Being affected by the US presidential election USD has lost its power and at the same time EUR is being weakened due to the economic reports from Germany. The support rests at 1.10860 with resistance at 1.11400 which both lines are above the weekly pivot point at 1.0945. The EMA of 10 is moving with bullish bias and it has crossed the EMA of 100 and EMA of 200. The RSI is moving in overbought area, the Stochastic is going horizontally in high ranges and the MACD indicator is in positive territory. The ADX is showing buy signal at the moment. The pair will rise along the ascendant channel targeting 1.1086.

https://fxglory.com/eurusd-analysis-for-03-11-2016/


GBPUSD analysis for 02.11.2016

GBPUSD is chiefly under the influence of UK’s Manufacturing PMI and Mark Carney’s comments. The support rests at 1.22100 with resistance at 1.23140 which both lines are below the weekly pivot point at 1.21820. The EMA of 10 is moving with bullish bias and it is located below the EMA of 100. The RSI is moving in overbought area, the Stochastic is showing upward momentum and the MACD indicator is in neutral territory. The ADX is showing stronger buy opportunity rather than sell. Long positions are recommended targeting 1.2300.

https://fxglory.com/gbpusd-analysis-for-02-11-2016/


EURUSD analysis for 02.11.2016

Due to the Fed, U.S. jobs data and election, USD is getting weak. The support rests at 1.10430 with resistance at 1.11190 which both lines are above the weekly pivot point at 1.0945. The EMA of 10 is moving with bullish bias and it has crossed the EMA of 100 and is headed towards the EMA of 200. The RSI is moving in overbought area, the Stochastic is going horizontally in high ranges and the MACD indicator is in positive territory. The ADX is showing buy signal at the moment. The chart appears to be bullish for today however the resistance zone at 1.111 area seems to be strong.

https://fxglory.com/eurusd-analysis-for-02-11-2016/


Friday, October 28, 2016

USDCAD analysis for 28.10.2016

Oil is leaving negative impact on CAD. The pair is finding support at 1.33580 with resistance at 1.34000 which both lines are above the weekly pivot point at 1.32310. The EMA of 10 is moving with bullish bias and it is located above the EMA of 100 and the EMA of 200. The RSI is rising towards the overbought area, the MACD indicator is in positive territory and the Stochastic is moving in high rates. The ADX is not showing any clear signal. The pair seems bullish today, long positions are recommended with the target at 1.3470.

https://fxglory.com/usdcad-analysis-for-28-10-2016/