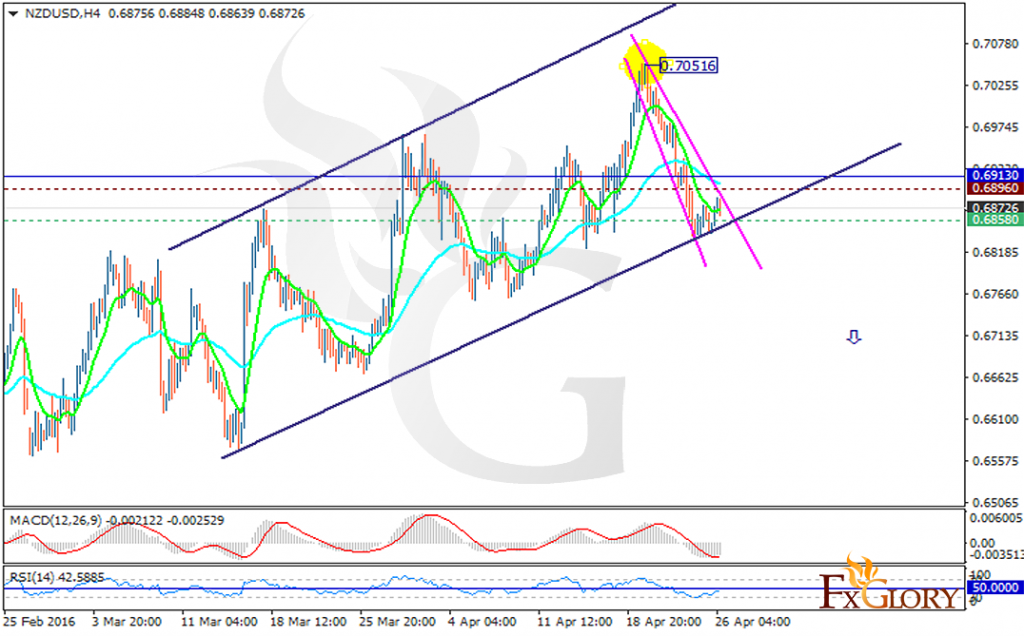
NZDUSD is moving within the long term ascendant channel in a choppy pattern but considering the short term chart, after hitting 0.70516, the pair has been falling down the descendant channel marked in purple. The support lies at 0.68580 with resistance at 0.68960 which both lines are below the weekly pivot point at 0.69130. The MACD indicator is in negative territory showing the price decline and the RSI is below the 50 level confirming the same scenario. Furthermore the EMA of 10 is moving below the EMA of 50 indicating the price action in lower ranges in the last recent days. As long as the pair is moving below the pivot point it will continue its bearish trend targeting 0.6790 otherwise, the resistance level breakout will push the pair towards higher ranges targeting 0.6935.
https://fxglory.com/technical-analysis-of-nzdusd-dated-26-04-2016/
No comments:
Post a Comment